
C++ का उपयोग करके प्रस्तुतियों में चार्ट डेटा लेबल प्रबंधित करें
परिचय
डेटा लेबल्स चार्ट सीरीज़ और व्यक्तिगत डेटा पॉइंट्स की जानकारी प्रदर्शित करते हैं, जिससे पाठकों को मानों की पहचान करने और चार्ट को समझने में मदद मिलती है। यह लेख बताता है कि मानों को कैसे स्वरूपित करें, प्रतिशत कैसे प्रदर्शित करें, लेबल टेक्स्ट को कैसे पढ़ें, अक्ष अधिकतम से परे लेबल्स को कैसे नियंत्रित करें, श्रेणी अक्ष लेबल स्पेसिंग को कैसे समायोजित करें, और पाई चार्ट लेबल्स को कैसे स्थित करें।
चार्ट डेटा लेबल्स में डेटा सटीकता सेट करें
सीरीज़ मानों को स्वरूपित करने के लिए set_NumberFormatOfValues का उपयोग करें। यह उदाहरण डिफ़ॉल्ट डेटा के साथ एक लाइन चार्ट बनाता है, उसकी डेटा टेबल दिखाता है, और पहली सीरीज़ के लिए मान लेबल्स सक्षम करता है। स्वरूप #,##0.00 हजार विभाजक और दो दशमलव स्थान दिखाता है बिना अंतर्निहित मानों को बदले।
#include <DOM/Presentation.h>
#include <DOM/ISlide.h>
#include <DOM/IShapeCollection.h>
#include <DOM/IChart.h>
#include <DOM/Chart/ChartType.h>
#include <DOM/Chart/IChartData.h>
#include <DOM/Chart/IChartSeriesCollection.h>
#include <DOM/Chart/IChartSeries.h>
#include <DOM/Chart/IDataLabelCollection.h>
#include <DOM/Chart/IDataLabelFormat.h>
#include <Export/SaveFormat.h>
#include <system/smart_ptr.h>
#include <system/string.h>

using namespace Aspose::Slides;
using namespace Aspose::Slides::Charts;
using namespace Aspose::Slides::Export;
using namespace System;

auto presentation = MakeObject<Presentation>();
auto slide = presentation->get_Slide(0);

auto chart = slide->get_Shapes()->AddChart(ChartType::Line, 50, 50, 450, 300);
chart->set_HasDataTable(true);

auto series = chart->get_ChartData()->get_Series()->idx_get(0);
series->set_NumberFormatOfValues(u"#,##0.00");
series->get_Labels()->get_DefaultDataLabelFormat()->set_ShowValue(true);

presentation->Save(u"PrecisionOfDatalabels_out.pptx", SaveFormat::Pptx);
लेबल्स के रूप में प्रतिशत दिखाएँ
एक स्टैक्ड कॉलम चार्ट के लिए, प्रत्येक मान को उसके श्रेणी कुल का प्रतिशत गणना करें और टेक्स्ट को उस टेक्स्ट फ्रेम में असाइन करें जो get_TextFrameForOverriding द्वारा लौटाया जाता है। यह उदाहरण डिफ़ॉल्ट चार्ट डेटा का उपयोग करता है और 8 पॉइंट फ़ॉन्ट में दो दशमलव स्थान के साथ प्रतिशत प्रदर्शित करता है। शून्य कुल वाली श्रेणियों को शून्य से भाग देने से बचने के लिए छोड़ दिया जाता है। यदि चार्ट डेटा बदलता है तो कस्टम लेबल टेक्स्ट को पुनः गणना करें।
#include <DOM/Presentation.h>
#include <DOM/ISlide.h>
#include <DOM/IShapeCollection.h>
#include <DOM/IChart.h>
#include <DOM/Chart/ChartType.h>
#include <DOM/Chart/IChartData.h>
#include <DOM/Chart/IChartCategoryCollection.h>
#include <DOM/Chart/IChartSeriesCollection.h>
#include <DOM/Chart/IChartSeries.h>
#include <DOM/Chart/IChartDataPointCollection.h>
#include <DOM/Chart/IChartDataPoint.h>
#include <DOM/Chart/IDoubleChartValue.h>
#include <DOM/Chart/IDataLabel.h>
#include <DOM/Chart/IDataLabelCollection.h>
#include <DOM/Chart/IDataLabelFormat.h>
#include <DOM/Portion.h>
#include <DOM/IPortionFormat.h>
#include <DOM/ITextFrame.h>
#include <DOM/IParagraph.h>
#include <DOM/IParagraphCollection.h>
#include <DOM/IPortionCollection.h>
#include <system/convert.h>
#include <vector>
#include <Export/SaveFormat.h>
#include <system/smart_ptr.h>
#include <system/string.h>

using namespace Aspose::Slides;
using namespace Aspose::Slides::Charts;
using namespace Aspose::Slides::Export;
using namespace System;

auto presentation = MakeObject<Presentation>();
auto slide = presentation->get_Slide(0);

auto chart = slide->get_Shapes()->AddChart(ChartType::StackedColumn, 20, 20, 400, 400);

auto categoryTotals = std::vector<double>(chart->get_ChartData()->get_Categories()->get_Count(), 0.0);
for (auto k = 0; k < chart->get_ChartData()->get_Categories()->get_Count(); k++)
{
    for (auto i = 0; i < chart->get_ChartData()->get_Series()->get_Count(); i++)
    {
        auto series = chart->get_ChartData()->get_Series()->idx_get(i);
        auto pointValue = Convert::ToDouble(series->get_DataPoint(k)->get_Value()->get_Data());
        categoryTotals[k] += pointValue;
    }
}

for (auto x = 0; x < chart->get_ChartData()->get_Series()->get_Count(); x++)
{
    auto series = chart->get_ChartData()->get_Series()->idx_get(x);
    series->get_Labels()->get_DefaultDataLabelFormat()->set_ShowLegendKey(false);

    for (auto j = 0; j < series->get_DataPoints()->get_Count(); j++)
    {
        auto label = series->get_DataPoint(j)->get_Label();
        if (categoryTotals[j] == 0)
        {
            continue;
        }

        auto pointValue = Convert::ToDouble(series->get_DataPoint(j)->get_Value()->get_Data());
        auto dataPointPercent = (pointValue / categoryTotals[j]) * 100;

        auto portion = MakeObject<Portion>();
        portion->set_Text(String::Format(u"{0:F2} %", dataPointPercent));
        portion->get_PortionFormat()->set_FontHeight(8.0f);

        label->get_TextFrameForOverriding()->set_Text(u"");

        auto paragraph = label->get_TextFrameForOverriding()->get_Paragraphs()->idx_get(0);
        paragraph->get_Portions()->Add(portion);

        label->get_DataLabelFormat()->set_ShowValue(true);
        label->get_DataLabelFormat()->set_ShowSeriesName(false);
        label->get_DataLabelFormat()->set_ShowPercentage(false);
        label->get_DataLabelFormat()->set_ShowLegendKey(false);
        label->get_DataLabelFormat()->set_ShowCategoryName(false);
        label->get_DataLabelFormat()->set_ShowBubbleSize(false);
    }
}

presentation->Save(u"DisplayPercentageAsLabels_out.pptx", SaveFormat::Pptx);
चार्ट डेटा लेबल्स के साथ प्रतिशत संकेत सेट करें
जब मान अंश के रूप में संग्रहीत होते हैं, तो प्रतिशत प्रदर्शित करने के लिए set_NumberFormat का उपयोग करें। स्रोत कोशिकाओं से स्वतंत्र रूप से लेबल स्वरूप लागू करने के लिए set_IsNumberFormatLinkedToSource को false पास करें।
यह उदाहरण चार श्रेणियों में लाल और नीली सीरीज़ के साथ 100 % स्टैक्ड कॉलम चार्ट बनाता है। प्रत्येक मान की जोड़ी का योग 1 होता है। लेबल स्वरूप 0.0% 0.30 को 30.0 % के रूप में दिखाता है, जबकि लंबवत अक्ष दो दशमलव स्थान उपयोग करता है। दोनों सीरीज़ सफ़ेद, 10‑पॉइंट लेबल टेक्स्ट उपयोग करती हैं।
#include <DOM/Presentation.h>
#include <DOM/ISlide.h>
#include <DOM/IShapeCollection.h>
#include <DOM/IChart.h>
#include <DOM/Chart/ChartType.h>
#include <DOM/Chart/IAxesManager.h>
#include <DOM/Chart/IAxis.h>
#include <DOM/Chart/IChartData.h>
#include <DOM/Chart/IChartCategoryCollection.h>
#include <DOM/Chart/IChartDataWorkbook.h>
#include <DOM/Chart/IChartDataCell.h>
#include <DOM/Chart/IChartSeriesCollection.h>
#include <DOM/Chart/IChartSeries.h>
#include <DOM/Chart/IChartDataPointCollection.h>
#include <DOM/Chart/IFormat.h>
#include <DOM/Chart/IDataLabelCollection.h>
#include <DOM/Chart/IDataLabelFormat.h>
#include <DOM/Chart/IChartTextFormat.h>
#include <DOM/Chart/IChartPortionFormat.h>
#include <DOM/FillType.h>
#include <DOM/IFillFormat.h>
#include <DOM/IColorFormat.h>
#include <drawing/color.h>
#include <system/object_ext.h>
#include <Export/SaveFormat.h>
#include <system/smart_ptr.h>
#include <system/string.h>

using namespace Aspose::Slides;
using namespace Aspose::Slides::Charts;
using namespace Aspose::Slides::Export;
using namespace System;
using namespace System::Drawing;

auto presentation = MakeObject<Presentation>();
auto slide = presentation->get_Slide(0);

auto chart = slide->get_Shapes()->AddChart(ChartType::PercentsStackedColumn, 20, 20, 500, 400);

chart->get_Axes()->get_VerticalAxis()->set_IsNumberFormatLinkedToSource(false);
chart->get_Axes()->get_VerticalAxis()->set_NumberFormat(u"0.00%");

chart->get_ChartData()->get_Series()->Clear();
chart->get_ChartData()->get_Categories()->Clear();

auto workbook = chart->get_ChartData()->get_ChartDataWorkbook();
auto worksheetIndex = 0;
for (auto i = 0; i < 4; i++)
{
    auto categoryCell = workbook->GetCell(worksheetIndex, i + 1, 0, ObjectExt::Box(String::Format(u"Category {0}", i + 1)));
    chart->get_ChartData()->get_Categories()->Add(categoryCell);
}

String seriesNames[] = { u"Reds", u"Blues" };
Color seriesColors[] = { Color::get_Red(), Color::get_Blue() };
double values[2][4] = { { 0.30, 0.50, 0.80, 0.65 }, { 0.70, 0.50, 0.20, 0.35 } };

for (auto i = 0; i < 2; i++)
{
    auto seriesCell = workbook->GetCell(worksheetIndex, 0, i + 1, ObjectExt::Box(seriesNames[i]));
    auto series = chart->get_ChartData()->get_Series()->Add(seriesCell, chart->get_Type());
    for (auto j = 0; j < 4; j++)
    {
        auto valueCell = workbook->GetCell(worksheetIndex, j + 1, i + 1, ObjectExt::Box(values[i][j]));
        series->get_DataPoints()->AddDataPointForBarSeries(valueCell);
    }

    series->get_Format()->get_Fill()->set_FillType(FillType::Solid);
    series->get_Format()->get_Fill()->get_SolidFillColor()->set_Color(seriesColors[i]);

    auto labelFormat = series->get_Labels()->get_DefaultDataLabelFormat();
    labelFormat->set_ShowValue(true);
    labelFormat->set_IsNumberFormatLinkedToSource(false);
    labelFormat->set_NumberFormat(u"0.0%");
    labelFormat->get_TextFormat()->get_PortionFormat()->set_FontHeight(10);
    labelFormat->get_TextFormat()->get_PortionFormat()->get_FillFormat()->set_FillType(FillType::Solid);
    labelFormat->get_TextFormat()->get_PortionFormat()->get_FillFormat()->get_SolidFillColor()->set_Color(Color::get_White());
}

presentation->Save(u"SetDataLabelsPercentageSign_out.pptx", SaveFormat::Pptx);
डेटा लेबल्स का वास्तविक टेक्स्ट पढ़ें
GetActualLabelText का उपयोग करके डेटा लेबल की सेटिंग्स द्वारा उत्पन्न टेक्स्ट प्राप्त करें। रिपोर्टों के लिए लेबल निकाले, प्रस्तुति सामग्री खोजे, या उत्पन्न चार्ट का सत्यापन करने में यह उपयोगी है। नीचे के उदाहरण में, डिफ़ॉल्ट data label format प्रत्येक श्रेणी नाम, सीरीज़ नाम और मान को जोड़ता है। एक पॉइंट अपना मान प्रतिशत के रूप में स्वरूपित करता है, और दूसरा get_TextFrameForOverriding से कस्टम टेक्स्ट उपयोग करता है।
#include <DOM/Presentation.h>
#include <DOM/ISlide.h>
#include <DOM/IShapeCollection.h>
#include <DOM/IChart.h>
#include <DOM/Chart/ChartType.h>
#include <DOM/Chart/IChartData.h>
#include <DOM/Chart/IChartCategoryCollection.h>
#include <DOM/Chart/IChartDataWorkbook.h>
#include <DOM/Chart/IChartDataCell.h>
#include <DOM/Chart/IChartSeriesCollection.h>
#include <DOM/Chart/IChartSeries.h>
#include <DOM/Chart/IChartDataPointCollection.h>
#include <DOM/Chart/IChartDataPoint.h>
#include <DOM/Chart/IDoubleChartValue.h>
#include <DOM/Chart/IDataLabel.h>
#include <DOM/Chart/IDataLabelCollection.h>
#include <DOM/Chart/IDataLabelFormat.h>
#include <DOM/ITextFrame.h>
#include <system/console.h>
#include <system/object_ext.h>
#include <system/smart_ptr.h>
#include <system/string.h>

using namespace Aspose::Slides;
using namespace Aspose::Slides::Charts;
using namespace System;

auto presentation = MakeObject<Presentation>();
auto slide = presentation->get_Slide(0);

auto chart = slide->get_Shapes()->AddChart(ChartType::ClusteredColumn, 20, 20, 500, 300);

chart->get_ChartData()->get_Series()->Clear();
chart->get_ChartData()->get_Categories()->Clear();

auto workbook = chart->get_ChartData()->get_ChartDataWorkbook();
auto firstCategoryCell = workbook->GetCell(0, 1, 0, ObjectExt::Box<String>(u"Q1"));
chart->get_ChartData()->get_Categories()->Add(firstCategoryCell);
auto secondCategoryCell = workbook->GetCell(0, 2, 0, ObjectExt::Box<String>(u"Q2"));
chart->get_ChartData()->get_Categories()->Add(secondCategoryCell);

auto northSeriesCell = workbook->GetCell(0, 0, 1, ObjectExt::Box<String>(u"North"));
auto north = chart->get_ChartData()->get_Series()->Add(northSeriesCell, chart->get_Type());
auto northFirstValueCell = workbook->GetCell(0, 1, 1, ObjectExt::Box(0.25));
north->get_DataPoints()->AddDataPointForBarSeries(northFirstValueCell);
auto northSecondValueCell = workbook->GetCell(0, 2, 1, ObjectExt::Box(0.75));
north->get_DataPoints()->AddDataPointForBarSeries(northSecondValueCell);

auto southSeriesCell = workbook->GetCell(0, 0, 2, ObjectExt::Box<String>(u"South"));
auto south = chart->get_ChartData()->get_Series()->Add(southSeriesCell, chart->get_Type());
auto southFirstValueCell = workbook->GetCell(0, 1, 2, ObjectExt::Box(0.40));
south->get_DataPoints()->AddDataPointForBarSeries(southFirstValueCell);
auto southSecondValueCell = workbook->GetCell(0, 2, 2, ObjectExt::Box(0.60));
south->get_DataPoints()->AddDataPointForBarSeries(southSecondValueCell);

for (auto i = 0; i < chart->get_ChartData()->get_Series()->get_Count(); i++)
{
    auto series = chart->get_ChartData()->get_Series()->idx_get(i);
    auto format = series->get_Labels()->get_DefaultDataLabelFormat();
    format->set_ShowCategoryName(true);
    format->set_ShowSeriesName(true);
    format->set_ShowValue(true);
}

north->get_Label(1)->get_DataLabelFormat()->set_IsNumberFormatLinkedToSource(false);
north->get_Label(1)->get_DataLabelFormat()->set_NumberFormat(u"0%");
south->get_Label(0)->get_TextFrameForOverriding()->set_Text(u"Reviewed");

for (auto i = 0; i < chart->get_ChartData()->get_Series()->get_Count(); i++)
{
    auto series = chart->get_ChartData()->get_Series()->idx_get(i);
    for (auto j = 0; j < series->get_DataPoints()->get_Count(); j++)
    {
        auto point = series->get_DataPoint(j);
        auto label = point->get_Label();
        if (!label->get_IsVisible())
        {
            continue;
        }

        Console::WriteLine(String::Format(u"Value: {0}; label: {1}", point->get_Value()->get_Data(), label->GetActualLabelText()));
    }
}
डेटा पॉइंट में संग्रहीत संख्या 0.75 बनी रहती है, चाहे उसका लेबल 75% के साथ श्रेणी और सीरीज़ नाम दिखाए। कस्टम टेक्स्ट उत्पन्न लेबल टेक्स्ट को बदल देता है। GetActualLabelText किसी भी स्थिति में परिणामस्वरूप लेबल स्ट्रिंग लौटाता है। जब आप केवल दृश्यमान लेबल्स निकालना चाहते हैं, तो ऊपर दिखाए अनुसार get_IsVisible को अलग से जांचें।
अक्ष अधिकतम से परे डेटा लेबल्स को नियंत्रित करें
जब आप मैन्युअल रूप से अक्ष सीमा सीमित करते हैं, तो कुछ डेटा पॉइंट्स उसकी अधिकतम से अधिक हो सकते हैं। यह नियंत्रित करने के लिए set_ShowDataLabelsOverMaximum का उपयोग करें कि उनके डेटा लेबल दिखाए जाएँ या नहीं। यह सेटिंग लेबल की दृश्यता बदलती है; यह अक्ष सीमा या अंतर्निहित डेटा मानों को नहीं बदलती।
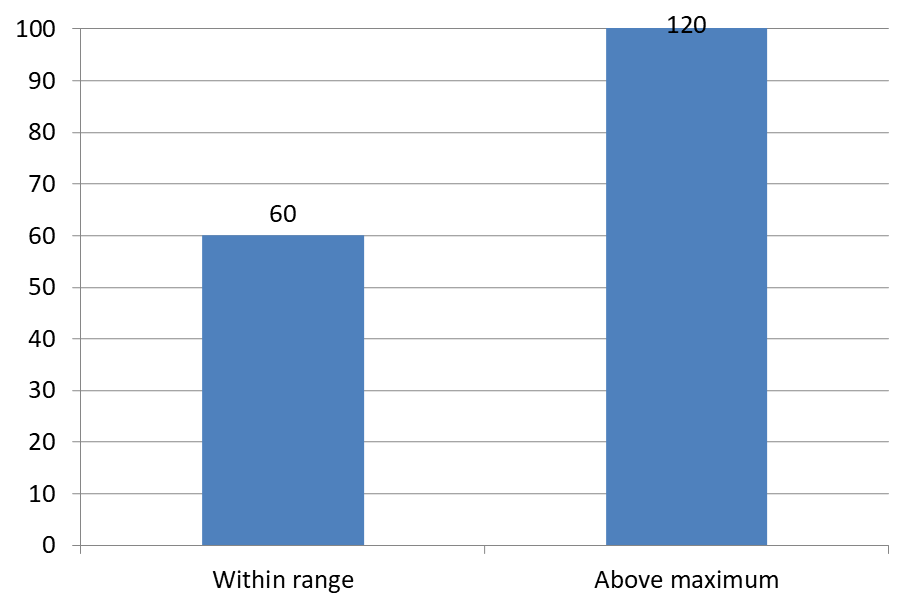
नीचे का उदाहरण 60 और 120 मानों के साथ 2D क्लस्टर्ड कॉलम चार्ट बनाता है। यह लंबवत अक्ष पर set_IsAutomaticMaxValue को false और set_MaxValue को 100 सेट करता है। पहली स्लाइड अधिकतम से परे लेबल की अनुमति देती है; उसकी एक प्रति उन्हें अक्षम करती है। दोनों स्लाइड्स DataLabelsOverMaximum.pptx में सहेजी गई हैं।
set_ShowValue से मान लेबल सक्षम करें। चार्ट‑स्तर का यह सेटिंग स्वयं मान प्रदर्शित नहीं करता और न ही व्यक्तिगत लेबल की अक्षम मान प्रदर्शनी को ओवरराइड करता है। यह उदाहरण पूरी सीरीज़ के लिए मान सक्षम करता है और set_Position का उपयोग करके प्रत्येक कॉलम के बाहरी छोर पर लेबल रखता है।
#include <DOM/Presentation.h>
#include <DOM/ISlide.h>
#include <DOM/ISlideCollection.h>
#include <DOM/IShapeCollection.h>
#include <DOM/IChart.h>
#include <DOM/Chart/ChartType.h>
#include <DOM/Chart/IAxesManager.h>
#include <DOM/Chart/IAxis.h>
#include <DOM/Chart/IChartData.h>
#include <DOM/Chart/IChartCategoryCollection.h>
#include <DOM/Chart/IChartDataWorkbook.h>
#include <DOM/Chart/IChartDataCell.h>
#include <DOM/Chart/IChartSeriesCollection.h>
#include <DOM/Chart/IChartSeries.h>
#include <DOM/Chart/IChartDataPointCollection.h>
#include <DOM/Chart/IDataLabelCollection.h>
#include <DOM/Chart/IDataLabelFormat.h>
#include <DOM/Chart/LegendDataLabelPosition.h>
#include <Export/SaveFormat.h>
#include <system/object_ext.h>
#include <system/smart_ptr.h>
#include <system/string.h>

using namespace Aspose::Slides;
using namespace Aspose::Slides::Charts;
using namespace Aspose::Slides::Export;
using namespace System;

auto presentation = MakeObject<Presentation>();
auto slide = presentation->get_Slide(0);

auto chart = slide->get_Shapes()->AddChart(ChartType::ClusteredColumn, 50, 50, 600, 400);
chart->set_HasLegend(false);

chart->get_ChartData()->get_Series()->Clear();
chart->get_ChartData()->get_Categories()->Clear();

auto workbook = chart->get_ChartData()->get_ChartDataWorkbook();

auto firstCategory = workbook->GetCell(0, 1, 0, ObjectExt::Box<String>(u"Within range"));
auto secondCategory = workbook->GetCell(0, 2, 0, ObjectExt::Box<String>(u"Above maximum"));

chart->get_ChartData()->get_Categories()->Add(firstCategory);
chart->get_ChartData()->get_Categories()->Add(secondCategory);

auto seriesName = workbook->GetCell(0, 0, 1, ObjectExt::Box<String>(u"Values"));
auto series = chart->get_ChartData()->get_Series()->Add(seriesName, chart->get_Type());

auto firstValue = workbook->GetCell(0, 1, 1, ObjectExt::Box(60));
auto secondValue = workbook->GetCell(0, 2, 1, ObjectExt::Box(120));

series->get_DataPoints()->AddDataPointForBarSeries(firstValue);
series->get_DataPoints()->AddDataPointForBarSeries(secondValue);

series->get_Labels()->get_DefaultDataLabelFormat()->set_ShowValue(true);
series->get_Labels()->get_DefaultDataLabelFormat()->set_Position(LegendDataLabelPosition::OutsideEnd);

chart->get_Axes()->get_VerticalAxis()->set_IsAutomaticMaxValue(false);
chart->get_Axes()->get_VerticalAxis()->set_MaxValue(100);
chart->set_ShowDataLabelsOverMaximum(true);

auto secondSlide = presentation->get_Slides()->AddClone(slide);
auto secondChart = ExplicitCast<IChart>(secondSlide->get_Shape(0));
secondChart->set_ShowDataLabelsOverMaximum(false);

presentation->Save(u"DataLabelsOverMaximum.pptx", SaveFormat::Pptx);
नीचे की छवियों में Microsoft PowerPoint द्वारा रेंडर किए गए सहेजे गए स्लाइड दिखाए गए हैं। true के साथ लेबल 120 ऊपर की सीमा पर दिखाई देता है; false के साथ वह छिपा रहता है। लेबल 60 दृश्य रहता है, अक्ष अधिकतम 100 पर बना रहता है, और दूसरा डेटा पॉइंट दोनों मामलों में 120 ही रहता है।
| ShowDataLabelsOverMaximum = true | ShowDataLabelsOverMaximum = false |
|---|---|
 |
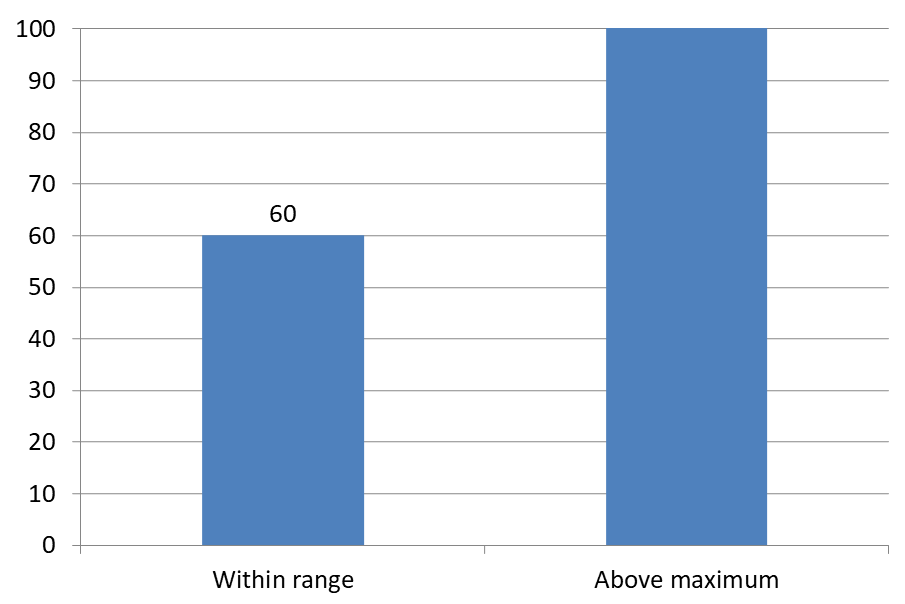 |
Chart Type
यह उदाहरण मान‑अक्ष के साथ 2D कॉलम चार्ट का उपयोग करता है। पाई और डोनट चार्ट जैसे बिना मान‑अक्ष वाले चार्ट्स में इस तरह का अक्ष अधिकतम सीमित नहीं किया जा सकता।अक्ष से लेबल दूरी सेट करें
set_LabelOffset का उपयोग करके श्रेणी अक्ष लेबल्स और अक्ष के बीच दूरी नियंत्रित करें। यह मान अक्ष लेबल्स के अधिकतम फ़ॉन्ट आकार का प्रतिशत होता है। यह उदाहरण एक क्लस्टर्ड कॉलम चार्ट बनाता है और क्षैतिज अक्ष लेबल ऑफ़सेट को 500 सेट करता है। यह सेटिंग व्यक्तिगत डेटा पॉइंट्स से जुड़े लेबल्स के बजाय श्रेणी अक्ष लेबल्स को प्रभावित करती है।
#include <DOM/Presentation.h>
#include <DOM/ISlide.h>
#include <DOM/IShapeCollection.h>
#include <DOM/IChart.h>
#include <DOM/Chart/ChartType.h>
#include <DOM/Chart/IAxesManager.h>
#include <DOM/Chart/IAxis.h>
#include <Export/SaveFormat.h>
#include <system/smart_ptr.h>
#include <system/string.h>

using namespace Aspose::Slides;
using namespace Aspose::Slides::Charts;
using namespace Aspose::Slides::Export;
using namespace System;

auto presentation = MakeObject<Presentation>();
auto slide = presentation->get_Slide(0);

auto chart = slide->get_Shapes()->AddChart(ChartType::ClusteredColumn, 20, 20, 500, 300);
chart->get_Axes()->get_HorizontalAxis()->set_LabelOffset(500);

presentation->Save(u"SetCategoryAxisLabelDistance_out.pptx", SaveFormat::Pptx);
लेबल स्थान समायोजित करें
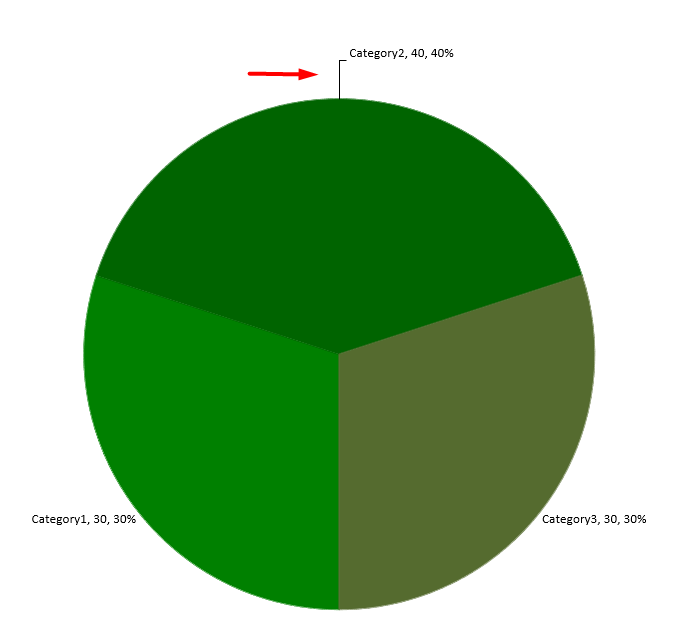
पाई चार्ट में डेटा लेबल की स्थितियों को समायोजित करके स्पेसिंग बेहतर बनाएं और लीडर लाइनों के लिए जगह बनाएं।
यह उदाहरण पहला डेटा पॉइंट का मान दिखाता है, उसका लेबल स्लाइस के बाहर रखता है, और ऑफ़सेट को समायोजित करने के लिए set_X और set_Y का उपयोग करता है। ये ऑफ़सेट क्रमशः चार्ट की चौड़ाई और ऊँचाई के सापेक्ष होते हैं।
#include <DOM/Presentation.h>
#include <DOM/ISlide.h>
#include <DOM/IShapeCollection.h>
#include <DOM/IChart.h>
#include <DOM/Chart/ChartType.h>
#include <DOM/Chart/IChartData.h>
#include <DOM/Chart/IChartSeriesCollection.h>
#include <DOM/Chart/IChartSeries.h>
#include <DOM/Chart/IDataLabel.h>
#include <DOM/Chart/IDataLabelFormat.h>
#include <DOM/Chart/LegendDataLabelPosition.h>
#include <Export/SaveFormat.h>
#include <system/smart_ptr.h>
#include <system/string.h>

using namespace Aspose::Slides;
using namespace Aspose::Slides::Charts;
using namespace Aspose::Slides::Export;
using namespace System;

auto presentation = MakeObject<Presentation>();
auto slide = presentation->get_Slide(0);

auto chart = slide->get_Shapes()->AddChart(ChartType::Pie, 50, 50, 200, 200);
auto series = chart->get_ChartData()->get_Series();

auto label = series->idx_get(0)->get_Label(0);
label->get_DataLabelFormat()->set_ShowValue(true);
label->get_DataLabelFormat()->set_Position(LegendDataLabelPosition::OutsideEnd);
label->set_X(0.71f);
label->set_Y(0.04f);

presentation->Save(u"presentation.pptx", SaveFormat::Pptx);
कॉलम चार्ट के ऊपर कई पंक्तियों में डेटा लेबल्स जोड़ें
यह उदाहरण दो पंक्तियों में डेटा लेबल्स के साथ कॉलम चार्ट बनाता है, जो प्लॉट एरिया के ऊपर स्थित होते हैं। सीरीज़ A दृश्य कॉलम प्रदर्शित करता है, जबकि सीरीज़ B और C अतिरिक्त लेबल प्रदान करते हैं। उनके कॉलम भराव और आउटलाइन हटाकर छिपा दिए जाते हैं। set_Overlap मेथड सभी तीन सीरीज़ को समान श्रेणी केंद्रों के साथ संरेखित करता है।
get_PlotArea सेटिंग्स लेबल पंक्तियों के लिए जगह आरक्षित करती हैं। ValidateChartLayout डिफ़ॉल्ट स्थितियों की गणना करने के बाद, set_X और set_Y क्षैतिज संरेखण को बनाए रखते हैं और दो पंक्तियों में लेबल व्यवस्थित करने के लिए ऊर्ध्वाधर ऑफ़सेट लागू करते हैं। संख्याएँ सीरीज़ मानों से जुड़ी डेटा लेबल्स ही रहती हैं; केवल पंक्ति हेडिंग अलग टेक्स्ट शैप होते हैं।
#include <DOM/Presentation.h>
#include <DOM/ISlide.h>
#include <DOM/IShapeCollection.h>
#include <DOM/IChart.h>
#include <DOM/Chart/ChartType.h>
#include <DOM/Chart/IChartData.h>
#include <DOM/Chart/IChartCategoryCollection.h>
#include <DOM/Chart/IChartDataWorkbook.h>
#include <DOM/Chart/IChartDataCell.h>
#include <DOM/Chart/IChartSeriesCollection.h>
#include <DOM/Chart/IChartSeries.h>
#include <DOM/Chart/IChartDataPointCollection.h>
#include <DOM/Chart/IChartDataPoint.h>
#include <DOM/Chart/IChartSeriesGroup.h>
#include <DOM/Chart/IFormat.h>
#include <DOM/Chart/IDataLabelCollection.h>
#include <DOM/Chart/IDataLabelFormat.h>
#include <DOM/Chart/IDataLabel.h>
#include <DOM/Chart/IChartTextFormat.h>
#include <DOM/Chart/IChartPortionFormat.h>
#include <DOM/Chart/LegendDataLabelPosition.h>
#include <DOM/Chart/IAxesManager.h>
#include <DOM/Chart/IAxis.h>
#include <DOM/Chart/IChartPlotArea.h>
#include <DOM/Chart/LayoutTargetType.h>
#include <DOM/FillType.h>
#include <DOM/IFillFormat.h>
#include <DOM/ILineFormat.h>
#include <DOM/IColorFormat.h>
#include <DOM/ShapeType.h>
#include <DOM/IAutoShape.h>
#include <DOM/ITextFrame.h>
#include <DOM/ITextFrameFormat.h>
#include <DOM/IParagraphCollection.h>
#include <DOM/IParagraph.h>
#include <DOM/IPortionCollection.h>
#include <DOM/IPortion.h>
#include <DOM/IPortionFormat.h>
#include <Export/SaveFormat.h>
#include <drawing/color.h>
#include <system/object_ext.h>
#include <system/smart_ptr.h>
#include <system/string.h>

using namespace Aspose::Slides;
using namespace Aspose::Slides::Charts;
using namespace Aspose::Slides::Export;
using namespace System;
using namespace System::Drawing;

auto presentation = MakeObject<Presentation>();
auto slide = presentation->get_Slide(0);

auto chart = slide->get_Shapes()->AddChart(ChartType::ClusteredColumn, 40, 40, 640, 200);
chart->set_HasTitle(false);
chart->set_HasLegend(false);
chart->get_TextFormat()->get_PortionFormat()->set_FontHeight(12);

chart->get_ChartData()->get_Series()->Clear();
chart->get_ChartData()->get_Categories()->Clear();

auto workbook = chart->get_ChartData()->get_ChartDataWorkbook();
workbook->Clear(0);

String categories[] = { u"North", u"South", u"East", u"West" };
String seriesNames[] = { u"Series A", u"Series B", u"Series C" };
double seriesValues[3][4] = {
    { 35, 42, 28, 47 },
    { 22, 31, 19, 26 },
    { 12, 16, 14, 18 }
};

for (auto categoryIndex = 0; categoryIndex < 4; categoryIndex++)
{
    auto categoryCell = workbook->GetCell(0, categoryIndex + 1, 0, ObjectExt::Box(categories[categoryIndex]));
    chart->get_ChartData()->get_Categories()->Add(categoryCell);
}

for (auto seriesIndex = 0; seriesIndex < 3; seriesIndex++)
{
    auto seriesCell = workbook->GetCell(0, 0, seriesIndex + 1, ObjectExt::Box(seriesNames[seriesIndex]));
    auto series = chart->get_ChartData()->get_Series()->Add(seriesCell, ChartType::ClusteredColumn);

    for (auto categoryIndex = 0; categoryIndex < 4; categoryIndex++)
    {
        auto valueCell = workbook->GetCell(0, categoryIndex + 1, seriesIndex + 1, ObjectExt::Box(seriesValues[seriesIndex][categoryIndex]));
        series->get_DataPoints()->AddDataPointForBarSeries(valueCell);
    }

    if (seriesIndex > 0)
    {
        // B और C के कॉलम छिपाएँ, लेकिन उनके डेटा लेबल रखें।
        series->get_Format()->get_Fill()->set_FillType(FillType::NoFill);
        series->get_Format()->get_Line()->get_FillFormat()->set_FillType(FillType::NoFill);
        auto labelFormat = series->get_Labels()->get_DefaultDataLabelFormat();
        labelFormat->set_ShowValue(true);
        labelFormat->get_TextFormat()->get_PortionFormat()->set_FontHeight(12);
        auto labelFill = labelFormat->get_TextFormat()->get_PortionFormat()->get_FillFormat();
        labelFill->set_FillType(FillType::Solid);
        labelFill->get_SolidFillColor()->set_Color(Color::get_Black());
        labelFormat->set_Position(LegendDataLabelPosition::InsideBase);
    }
}

// तीनों सीरीज़ को समान श्रेणी केंद्रों के साथ संरेखित करें।
chart->get_ChartData()->get_Series()->idx_get(0)->get_ParentSeriesGroup()->set_Overlap(100);

// इस संक्षिप्त उदाहरण के लिए कम ग्रिडलाइन उपयोग करें।
chart->get_Axes()->get_VerticalAxis()->set_IsAutomaticMajorUnit(false);
chart->get_Axes()->get_VerticalAxis()->set_MajorUnit(10);

// प्लॉट के ऊपर दो पंक्तियों के डेटा लेबल्स के लिए जगह आरक्षित करें।
chart->get_PlotArea()->set_LayoutTargetType(LayoutTargetType::Inner);
chart->get_PlotArea()->set_X(0.15f);
chart->get_PlotArea()->set_Y(0.32f);
chart->get_PlotArea()->set_Width(0.80f);
chart->get_PlotArea()->set_Height(0.48f);
chart->ValidateChartLayout();

for (auto seriesIndex = 1; seriesIndex < 3; seriesIndex++)
{
    auto series = chart->get_ChartData()->get_Series()->idx_get(seriesIndex);
    auto rowTop = seriesIndex == 1 ? 0.15f : 0.03f;

    for (auto categoryIndex = 0; categoryIndex < 4; categoryIndex++)
    {
        auto dataLabel = series->get_DataPoint(categoryIndex)->get_Label();
        // डिफ़ॉल्ट क्षैतिज स्थिति रखें।
        // Y डिफ़ॉल्ट लेबल स्थिति से एक ऑफ़सेट है, जो चार्ट-ऊँचाई का अंश के रूप में व्यक्त है।
        dataLabel->set_X(0);
        dataLabel->set_Y(rowTop - dataLabel->get_ActualY() / chart->get_Height());
    }

    // केवल पंक्ति शीर्षक एक अलग टेक्स्ट शेप है।
    auto rowHeading = slide->get_Shapes()->AddAutoShape(ShapeType::Rectangle, chart->get_X(), chart->get_Y() + rowTop * chart->get_Height(), 85, 18);
    rowHeading->get_FillFormat()->set_FillType(FillType::NoFill);
    rowHeading->get_LineFormat()->get_FillFormat()->set_FillType(FillType::NoFill);
    rowHeading->AddTextFrame(seriesNames[seriesIndex]);
    rowHeading->get_TextFrame()->get_TextFrameFormat()->set_MarginTop(0);
    rowHeading->get_TextFrame()->get_TextFrameFormat()->set_MarginBottom(0);
    auto headingFormat = rowHeading->get_TextFrame()->get_Paragraphs()->idx_get(0)->get_Portions()->idx_get(0)->get_PortionFormat();
    headingFormat->set_FontHeight(12);
    headingFormat->get_FillFormat()->set_FillType(FillType::Solid);
    headingFormat->get_FillFormat()->get_SolidFillColor()->set_Color(Color::get_Black());
}

presentation->Save(u"multiple-rows-of-labels.pptx", SaveFormat::Pptx);

अक्सर पूछे जाने वाले प्रश्न
मैं घने चार्ट्स में डेटा लेबल्स के ओवरलैप को कैसे रोक सकता हूँ?
ऑटोमैटिक लेबल प्लेसमेंट, लीडर लाइनों और छोटे फ़ॉन्ट आकार को संयोजित करें; यदि आवश्यक हो तो कुछ फील्ड (जैसे श्रेणी) छिपाएँ या केवल अतिच Extreme मानों या प्रमुख बिंदुओं के लिए लेबल दिखाएँ।
मैं शून्य, नकारात्मक या खाली मानों के लिए लेबल्स को केवल कैसे अक्षम कर सकता हूँ?
लेबल सक्षम करने से पहले डेटा पॉइंट्स को फ़िल्टर करें और 0, नकारात्मक या अनुपलब्ध मानों के लिए डिस्प्ले को बंद करने के नियम निर्धारित करें।
PDF/छवियों में निर्यात करते समय मैं लेबल शैली को स्थिर कैसे रख सकता हूँ?
फ़ॉन्ट परिवार और आकार को स्पष्ट रूप से सेट करें और सुनिश्चित करें कि रेंडरिंग वातावरण में फ़ॉन्ट उपलब्ध हो ताकि फ़ॉलबैक न हो।