
إدارة تسميات بيانات المخطط في العروض التقديمية باستخدام C++
مقدمة
تُظهر تسميات البيانات معلومات حول سلاسل المخطط والنقاط الفردية للبيانات، مما يساعد القراء على التعرف على القيم وفهم المخطط. يشرح هذا المقال كيفية تنسيق القيم، عرض النسب المئوية، قراءة نص التسمية، التحكم في التسميات خارج الحد الأقصى للمحور، ضبط تباعد تسميات محور الفئات، وتحديد مواضع تسميات المخطط الدائري.
تعيين دقة البيانات في تسميات بيانات المخطط
استخدم set_NumberFormatOfValues لتنسيق قيم السلسلة. ينشئ هذا المثال مخطط خط مع بيانات افتراضية، يعرض جدول البيانات الخاص به، ويفعل تسميات القيم للسلسلة الأولى. التنسيق #,##0.00 يعرض فاصل الآلاف ومكانين عشريين دون تغيير القيم الأساسية.
#include <DOM/Presentation.h>
#include <DOM/ISlide.h>
#include <DOM/IShapeCollection.h>
#include <DOM/IChart.h>
#include <DOM/Chart/ChartType.h>
#include <DOM/Chart/IChartData.h>
#include <DOM/Chart/IChartSeriesCollection.h>
#include <DOM/Chart/IChartSeries.h>
#include <DOM/Chart/IDataLabelCollection.h>
#include <DOM/Chart/IDataLabelFormat.h>
#include <Export/SaveFormat.h>
#include <system/smart_ptr.h>
#include <system/string.h>

using namespace Aspose::Slides;
using namespace Aspose::Slides::Charts;
using namespace Aspose::Slides::Export;
using namespace System;

auto presentation = MakeObject<Presentation>();
auto slide = presentation->get_Slide(0);

auto chart = slide->get_Shapes()->AddChart(ChartType::Line, 50, 50, 450, 300);
chart->set_HasDataTable(true);

auto series = chart->get_ChartData()->get_Series()->idx_get(0);
series->set_NumberFormatOfValues(u"#,##0.00");
series->get_Labels()->get_DefaultDataLabelFormat()->set_ShowValue(true);

presentation->Save(u"PrecisionOfDatalabels_out.pptx", SaveFormat::Pptx);
عرض النسبة المئوية كتسميات
لإنشاء مخطط عمود مكدس، احسب كل قيمة كنسبة مئوية من مجموع الفئة الخاصة بها وعيّن النص إلى إطار النص الذي يُرجعه get_TextFrameForOverriding. يستخدم هذا المثال بيانات المخطط الافتراضية ويعرض النسب المئوية بمكانين عشريين بخط بحجم 8 نقاط. يتم تخطي الفئات التي مجموعها صفر لتجنب القسمة على الصفر. أعد حساب نص التسمية المخصص إذا تغيرت بيانات المخطط.
#include <DOM/Presentation.h>
#include <DOM/ISlide.h>
#include <DOM/IShapeCollection.h>
#include <DOM/IChart.h>
#include <DOM/Chart/ChartType.h>
#include <DOM/Chart/IChartData.h>
#include <DOM/Chart/IChartCategoryCollection.h>
#include <DOM/Chart/IChartSeriesCollection.h>
#include <DOM/Chart/IChartSeries.h>
#include <DOM/Chart/IChartDataPointCollection.h>
#include <DOM/Chart/IChartDataPoint.h>
#include <DOM/Chart/IDoubleChartValue.h>
#include <DOM/Chart/IDataLabel.h>
#include <DOM/Chart/IDataLabelCollection.h>
#include <DOM/Chart/IDataLabelFormat.h>
#include <DOM/Portion.h>
#include <DOM/IPortionFormat.h>
#include <DOM/ITextFrame.h>
#include <DOM/IParagraph.h>
#include <DOM/IParagraphCollection.h>
#include <DOM/IPortionCollection.h>
#include <system/convert.h>
#include <vector>
#include <Export/SaveFormat.h>
#include <system/smart_ptr.h>
#include <system/string.h>

using namespace Aspose::Slides;
using namespace Aspose::Slides::Charts;
using namespace Aspose::Slides::Export;
using namespace System;

auto presentation = MakeObject<Presentation>();
auto slide = presentation->get_Slide(0);

auto chart = slide->get_Shapes()->AddChart(ChartType::StackedColumn, 20, 20, 400, 400);

auto categoryTotals = std::vector<double>(chart->get_ChartData()->get_Categories()->get_Count(), 0.0);
for (auto k = 0; k < chart->get_ChartData()->get_Categories()->get_Count(); k++)
{
    for (auto i = 0; i < chart->get_ChartData()->get_Series()->get_Count(); i++)
    {
        auto series = chart->get_ChartData()->get_Series()->idx_get(i);
        auto pointValue = Convert::ToDouble(series->get_DataPoint(k)->get_Value()->get_Data());
        categoryTotals[k] += pointValue;
    }
}

for (auto x = 0; x < chart->get_ChartData()->get_Series()->get_Count(); x++)
{
    auto series = chart->get_ChartData()->get_Series()->idx_get(x);
    series->get_Labels()->get_DefaultDataLabelFormat()->set_ShowLegendKey(false);

    for (auto j = 0; j < series->get_DataPoints()->get_Count(); j++)
    {
        auto label = series->get_DataPoint(j)->get_Label();
        if (categoryTotals[j] == 0)
        {
            continue;
        }

        auto pointValue = Convert::ToDouble(series->get_DataPoint(j)->get_Value()->get_Data());
        auto dataPointPercent = (pointValue / categoryTotals[j]) * 100;

        auto portion = MakeObject<Portion>();
        portion->set_Text(String::Format(u"{0:F2} %", dataPointPercent));
        portion->get_PortionFormat()->set_FontHeight(8.0f);

        label->get_TextFrameForOverriding()->set_Text(u"");

        auto paragraph = label->get_TextFrameForOverriding()->get_Paragraphs()->idx_get(0);
        paragraph->get_Portions()->Add(portion);

        label->get_DataLabelFormat()->set_ShowValue(true);
        label->get_DataLabelFormat()->set_ShowSeriesName(false);
        label->get_DataLabelFormat()->set_ShowPercentage(false);
        label->get_DataLabelFormat()->set_ShowLegendKey(false);
        label->get_DataLabelFormat()->set_ShowCategoryName(false);
        label->get_DataLabelFormat()->set_ShowBubbleSize(false);
    }
}

presentation->Save(u"DisplayPercentageAsLabels_out.pptx", SaveFormat::Pptx);
تعيين علامة النسبة المئوية في تسميات بيانات المخطط
عند تخزين القيم ككسور، استخدم set_NumberFormat لعرض النسب المئوية. مرّر false إلى set_IsNumberFormatLinkedToSource لتطبيق تنسيق التسمية بشكل مستقل عن خلايا المصدر.
ينشئ هذا المثال مخطط عمود مكدس 100% مع سلسلتين حمراء وزرقاء عبر أربع فئات. كل زوج من القيم يضيف إلى 1. تنسيق التسمية 0.0% يعرض 0.30 كـ30.0%، بينما يستخدم المحور الرأسي مكانين عشريين. تستخدم السلسلتان نصًا أبيض بحجم 10 نقاط للتسمية.
#include <DOM/Presentation.h>
#include <DOM/ISlide.h>
#include <DOM/IShapeCollection.h>
#include <DOM/IChart.h>
#include <DOM/Chart/ChartType.h>
#include <DOM/Chart/IAxesManager.h>
#include <DOM/Chart/IAxis.h>
#include <DOM/Chart/IChartData.h>
#include <DOM/Chart/IChartCategoryCollection.h>
#include <DOM/Chart/IChartDataWorkbook.h>
#include <DOM/Chart/IChartDataCell.h>
#include <DOM/Chart/IChartSeriesCollection.h>
#include <DOM/Chart/IChartSeries.h>
#include <DOM/Chart/IChartDataPointCollection.h>
#include <DOM/Chart/IFormat.h>
#include <DOM/Chart/IDataLabelCollection.h>
#include <DOM/Chart/IDataLabelFormat.h>
#include <DOM/Chart/IChartTextFormat.h>
#include <DOM/Chart/IChartPortionFormat.h>
#include <DOM/FillType.h>
#include <DOM/IFillFormat.h>
#include <DOM/IColorFormat.h>
#include <drawing/color.h>
#include <system/object_ext.h>
#include <Export/SaveFormat.h>
#include <system/smart_ptr.h>
#include <system/string.h>

using namespace Aspose::Slides;
using namespace Aspose::Slides::Charts;
using namespace Aspose::Slides::Export;
using namespace System;
using namespace System::Drawing;

auto presentation = MakeObject<Presentation>();
auto slide = presentation->get_Slide(0);

auto chart = slide->get_Shapes()->AddChart(ChartType::PercentsStackedColumn, 20, 20, 500, 400);

chart->get_Axes()->get_VerticalAxis()->set_IsNumberFormatLinkedToSource(false);
chart->get_Axes()->get_VerticalAxis()->set_NumberFormat(u"0.00%");

chart->get_ChartData()->get_Series()->Clear();
chart->get_ChartData()->get_Categories()->Clear();

auto workbook = chart->get_ChartData()->get_ChartDataWorkbook();
auto worksheetIndex = 0;
for (auto i = 0; i < 4; i++)
{
    auto categoryCell = workbook->GetCell(worksheetIndex, i + 1, 0, ObjectExt::Box(String::Format(u"Category {0}", i + 1)));
    chart->get_ChartData()->get_Categories()->Add(categoryCell);
}

String seriesNames[] = { u"Reds", u"Blues" };
Color seriesColors[] = { Color::get_Red(), Color::get_Blue() };
double values[2][4] = { { 0.30, 0.50, 0.80, 0.65 }, { 0.70, 0.50, 0.20, 0.35 } };

for (auto i = 0; i < 2; i++)
{
    auto seriesCell = workbook->GetCell(worksheetIndex, 0, i + 1, ObjectExt::Box(seriesNames[i]));
    auto series = chart->get_ChartData()->get_Series()->Add(seriesCell, chart->get_Type());
    for (auto j = 0; j < 4; j++)
    {
        auto valueCell = workbook->GetCell(worksheetIndex, j + 1, i + 1, ObjectExt::Box(values[i][j]));
        series->get_DataPoints()->AddDataPointForBarSeries(valueCell);
    }

    series->get_Format()->get_Fill()->set_FillType(FillType::Solid);
    series->get_Format()->get_Fill()->get_SolidFillColor()->set_Color(seriesColors[i]);

    auto labelFormat = series->get_Labels()->get_DefaultDataLabelFormat();
    labelFormat->set_ShowValue(true);
    labelFormat->set_IsNumberFormatLinkedToSource(false);
    labelFormat->set_NumberFormat(u"0.0%");
    labelFormat->get_TextFormat()->get_PortionFormat()->set_FontHeight(10);
    labelFormat->get_TextFormat()->get_PortionFormat()->get_FillFormat()->set_FillType(FillType::Solid);
    labelFormat->get_TextFormat()->get_PortionFormat()->get_FillFormat()->get_SolidFillColor()->set_Color(Color::get_White());
}

presentation->Save(u"SetDataLabelsPercentageSign_out.pptx", SaveFormat::Pptx);
قراءة النص الفعلي لتسميات البيانات
استخدم GetActualLabelText لاسترجاع النص الذي تنتجه إعدادات تسمية البيانات. هذا مفيد عند استخراج التسميات للتقارير، البحث في محتوى العرض التقديمي، أو التحقق من صحة المخططات المُولَّدة. في المثال أدناه، يدمج data label format الافتراضي كل من اسم الفئة، اسم السلسلة، والقيمة. نقطة واحدة تُنسق قيمتها كنسبة مئوية، وأخرى تستخدم نصًا مخصصًا من get_TextFrameForOverriding.
#include <DOM/Presentation.h>
#include <DOM/ISlide.h>
#include <DOM/IShapeCollection.h>
#include <DOM/IChart.h>
#include <DOM/Chart/ChartType.h>
#include <DOM/Chart/IChartData.h>
#include <DOM/Chart/IChartCategoryCollection.h>
#include <DOM/Chart/IChartDataWorkbook.h>
#include <DOM/Chart/IChartDataCell.h>
#include <DOM/Chart/IChartSeriesCollection.h>
#include <DOM/Chart/IChartSeries.h>
#include <DOM/Chart/IChartDataPointCollection.h>
#include <DOM/Chart/IChartDataPoint.h>
#include <DOM/Chart/IDoubleChartValue.h>
#include <DOM/Chart/IDataLabel.h>
#include <DOM/Chart/IDataLabelCollection.h>
#include <DOM/Chart/IDataLabelFormat.h>
#include <DOM/ITextFrame.h>
#include <system/console.h>
#include <system/object_ext.h>
#include <system/smart_ptr.h>
#include <system/string.h>

using namespace Aspose::Slides;
using namespace Aspose::Slides::Charts;
using namespace System;

auto presentation = MakeObject<Presentation>();
auto slide = presentation->get_Slide(0);

auto chart = slide->get_Shapes()->AddChart(ChartType::ClusteredColumn, 20, 20, 500, 300);

chart->get_ChartData()->get_Series()->Clear();
chart->get_ChartData()->get_Categories()->Clear();

auto workbook = chart->get_ChartData()->get_ChartDataWorkbook();
auto firstCategoryCell = workbook->GetCell(0, 1, 0, ObjectExt::Box<String>(u"Q1"));
chart->get_ChartData()->get_Categories()->Add(firstCategoryCell);
auto secondCategoryCell = workbook->GetCell(0, 2, 0, ObjectExt::Box<String>(u"Q2"));
chart->get_ChartData()->get_Categories()->Add(secondCategoryCell);

auto northSeriesCell = workbook->GetCell(0, 0, 1, ObjectExt::Box<String>(u"North"));
auto north = chart->get_ChartData()->get_Series()->Add(northSeriesCell, chart->get_Type());
auto northFirstValueCell = workbook->GetCell(0, 1, 1, ObjectExt::Box(0.25));
north->get_DataPoints()->AddDataPointForBarSeries(northFirstValueCell);
auto northSecondValueCell = workbook->GetCell(0, 2, 1, ObjectExt::Box(0.75));
north->get_DataPoints()->AddDataPointForBarSeries(northSecondValueCell);

auto southSeriesCell = workbook->GetCell(0, 0, 2, ObjectExt::Box<String>(u"South"));
auto south = chart->get_ChartData()->get_Series()->Add(southSeriesCell, chart->get_Type());
auto southFirstValueCell = workbook->GetCell(0, 1, 2, ObjectExt::Box(0.40));
south->get_DataPoints()->AddDataPointForBarSeries(southFirstValueCell);
auto southSecondValueCell = workbook->GetCell(0, 2, 2, ObjectExt::Box(0.60));
south->get_DataPoints()->AddDataPointForBarSeries(southSecondValueCell);

for (auto i = 0; i < chart->get_ChartData()->get_Series()->get_Count(); i++)
{
    auto series = chart->get_ChartData()->get_Series()->idx_get(i);
    auto format = series->get_Labels()->get_DefaultDataLabelFormat();
    format->set_ShowCategoryName(true);
    format->set_ShowSeriesName(true);
    format->set_ShowValue(true);
}

north->get_Label(1)->get_DataLabelFormat()->set_IsNumberFormatLinkedToSource(false);
north->get_Label(1)->get_DataLabelFormat()->set_NumberFormat(u"0%");
south->get_Label(0)->get_TextFrameForOverriding()->set_Text(u"Reviewed");

for (auto i = 0; i < chart->get_ChartData()->get_Series()->get_Count(); i++)
{
    auto series = chart->get_ChartData()->get_Series()->idx_get(i);
    for (auto j = 0; j < series->get_DataPoints()->get_Count(); j++)
    {
        auto point = series->get_DataPoint(j);
        auto label = point->get_Label();
        if (!label->get_IsVisible())
        {
            continue;
        }

        Console::WriteLine(String::Format(u"Value: {0}; label: {1}", point->get_Value()->get_Data(), label->GetActualLabelText()));
    }
}
الرقم المخزن في نقطة البيانات يبقى 0.75، حتى عندما تُظهر تسميتها 75% مع أسماء الفئة والسلسلة. يستبدل النص المخصص النص المُولَّد لتسمية البيانات. تُعيد GetActualLabelText سلسلة التسمية الناتجة في كلتا الحالتين. تحقق من get_IsVisible بشكل منفصل، كما هو موضح أعلاه، عندما تريد استخراج التسميات الظاهرة فقط.
التحكم في تسميات البيانات خارج الحد الأقصى للمحور
عندما تحدد نطاق المحور يدويًا، قد تتجاوز بعض نقاط البيانات الحد الأقصى له. استخدم set_ShowDataLabelsOverMaximum للتحكم في ما إذا كانت تسميات البيانات الخاصة بها تُظهر. يغيّر هذا الإعداد رؤية التسمية؛ لا يغيّر نطاق المحور ولا القيم الأساسية للبيانات.
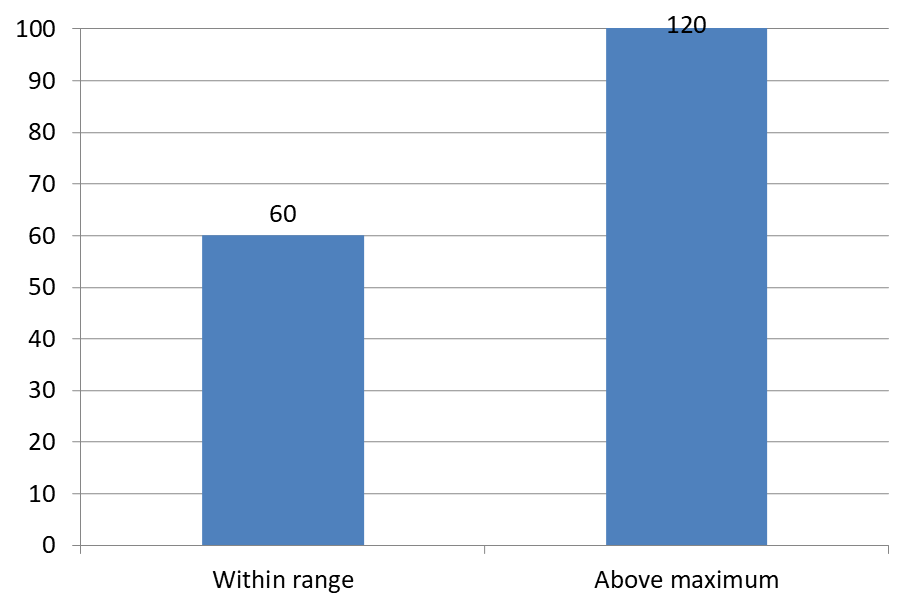
ينشئ المثال أدناه مخطط عمود مجمع ثلاثي الأبعاد 2D بقيم 60 و120. يعيّن set_IsAutomaticMaxValue إلى false وset_MaxValue إلى 100 على المحور الرأسي. الشريحة الأولى تسمح بتسميات تتجاوز الحد الأقصى؛ نسخة من تلك الشريحة تعطلها. تُحفظ كلتا الشريحتين في DataLabelsOverMaximum.pptx.
فعّل تسميات القيم باستخدام set_ShowValue. لا يُمكّن إعداد مستوى المخطط عرض القيم بحد ذاته ولا يتجاوز تعطيل عرض القيمة لتسمية فردية. يُفعّل هذا المثال القيم لكامل السلسلة ويستخدم set_Position لوضع التسميات في الطرف الخارجي لكل عمود.
#include <DOM/Presentation.h>
#include <DOM/ISlide.h>
#include <DOM/ISlideCollection.h>
#include <DOM/IShapeCollection.h>
#include <DOM/IChart.h>
#include <DOM/Chart/ChartType.h>
#include <DOM/Chart/IAxesManager.h>
#include <DOM/Chart/IAxis.h>
#include <DOM/Chart/IChartData.h>
#include <DOM/Chart/IChartCategoryCollection.h>
#include <DOM/Chart/IChartDataWorkbook.h>
#include <DOM/Chart/IChartDataCell.h>
#include <DOM/Chart/IChartSeriesCollection.h>
#include <DOM/Chart/IChartSeries.h>
#include <DOM/Chart/IChartDataPointCollection.h>
#include <DOM/Chart/IDataLabelCollection.h>
#include <DOM/Chart/IDataLabelFormat.h>
#include <DOM/Chart/LegendDataLabelPosition.h>
#include <Export/SaveFormat.h>
#include <system/object_ext.h>
#include <system/smart_ptr.h>
#include <system/string.h>

using namespace Aspose::Slides;
using namespace Aspose::Slides::Charts;
using namespace Aspose::Slides::Export;
using namespace System;

auto presentation = MakeObject<Presentation>();
auto slide = presentation->get_Slide(0);

auto chart = slide->get_Shapes()->AddChart(ChartType::ClusteredColumn, 50, 50, 600, 400);
chart->set_HasLegend(false);

chart->get_ChartData()->get_Series()->Clear();
chart->get_ChartData()->get_Categories()->Clear();

auto workbook = chart->get_ChartData()->get_ChartDataWorkbook();

auto firstCategory = workbook->GetCell(0, 1, 0, ObjectExt::Box<String>(u"Within range"));
auto secondCategory = workbook->GetCell(0, 2, 0, ObjectExt::Box<String>(u"Above maximum"));

chart->get_ChartData()->get_Categories()->Add(firstCategory);
chart->get_ChartData()->get_Categories()->Add(secondCategory);

auto seriesName = workbook->GetCell(0, 0, 1, ObjectExt::Box<String>(u"Values"));
auto series = chart->get_ChartData()->get_Series()->Add(seriesName, chart->get_Type());

auto firstValue = workbook->GetCell(0, 1, 1, ObjectExt::Box(60));
auto secondValue = workbook->GetCell(0, 2, 1, ObjectExt::Box(120));

series->get_DataPoints()->AddDataPointForBarSeries(firstValue);
series->get_DataPoints()->AddDataPointForBarSeries(secondValue);

series->get_Labels()->get_DefaultDataLabelFormat()->set_ShowValue(true);
series->get_Labels()->get_DefaultDataLabelFormat()->set_Position(LegendDataLabelPosition::OutsideEnd);

chart->get_Axes()->get_VerticalAxis()->set_IsAutomaticMaxValue(false);
chart->get_Axes()->get_VerticalAxis()->set_MaxValue(100);
chart->set_ShowDataLabelsOverMaximum(true);

auto secondSlide = presentation->get_Slides()->AddClone(slide);
auto secondChart = ExplicitCast<IChart>(secondSlide->get_Shape(0));
secondChart->set_ShowDataLabelsOverMaximum(false);

presentation->Save(u"DataLabelsOverMaximum.pptx", SaveFormat::Pptx);
تظهر الصور التالية الشرائح المحفوظة التي تم عرضها بواسطة Microsoft PowerPoint. مع true، تكون التسمية 120 مرئية عند الحد العلوي؛ مع false، تكون مخفية. تبقى التسمية 60 مرئية، ويظل الحد الأقصى للمحور عند 100، وتبقى نقطة البيانات الثانية 120 في الحالتين.
| ShowDataLabelsOverMaximum = true | ShowDataLabelsOverMaximum = false |
|---|---|
 |
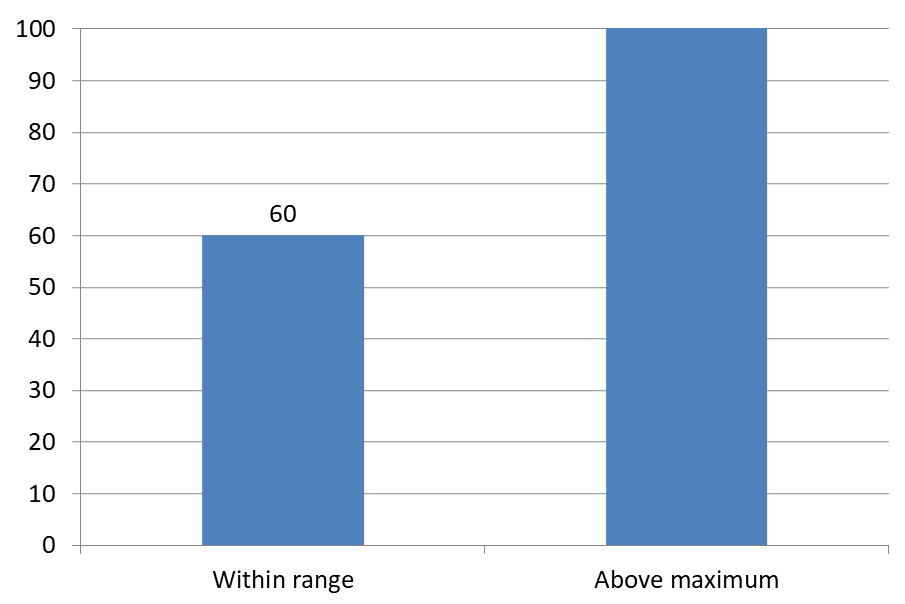 |
Chart Type
يستخدم هذا المثال مخطط عمود ثنائي الأبعاد مع محور قيم. المخططات التي لا تحتوي على محور قيم، مثل المخططات الدائرية ومخططات الدونات، لا تمتلك حدًا أقصى للمحور لتقييده بهذه الطريقة.تعيين مسافة التسمية من المحور
استخدم set_LabelOffset للتحكم في المسافة بين تسميات محور الفئات والمحور. القيمة هي نسبة مئوية من حجم الخط الأقصى لتسميات المحور. ينشئ هذا المثال مخطط عمود مجمع ويعيّن إزاحة تسمية المحور الأفقي إلى 500. يؤثر هذا الإعداد على تسميات محور الفئات بدلاً من التسميات المرتبطة بنقاط البيانات الفردية.
#include <DOM/Presentation.h>
#include <DOM/ISlide.h>
#include <DOM/IShapeCollection.h>
#include <DOM/IChart.h>
#include <DOM/Chart/ChartType.h>
#include <DOM/Chart/IAxesManager.h>
#include <DOM/Chart/IAxis.h>
#include <Export/SaveFormat.h>
#include <system/smart_ptr.h>
#include <system/string.h>

using namespace Aspose::Slides;
using namespace Aspose::Slides::Charts;
using namespace Aspose::Slides::Export;
using namespace System;

auto presentation = MakeObject<Presentation>();
auto slide = presentation->get_Slide(0);

auto chart = slide->get_Shapes()->AddChart(ChartType::ClusteredColumn, 20, 20, 500, 300);
chart->get_Axes()->get_HorizontalAxis()->set_LabelOffset(500);

presentation->Save(u"SetCategoryAxisLabelDistance_out.pptx", SaveFormat::Pptx);
ضبط موقع التسمية
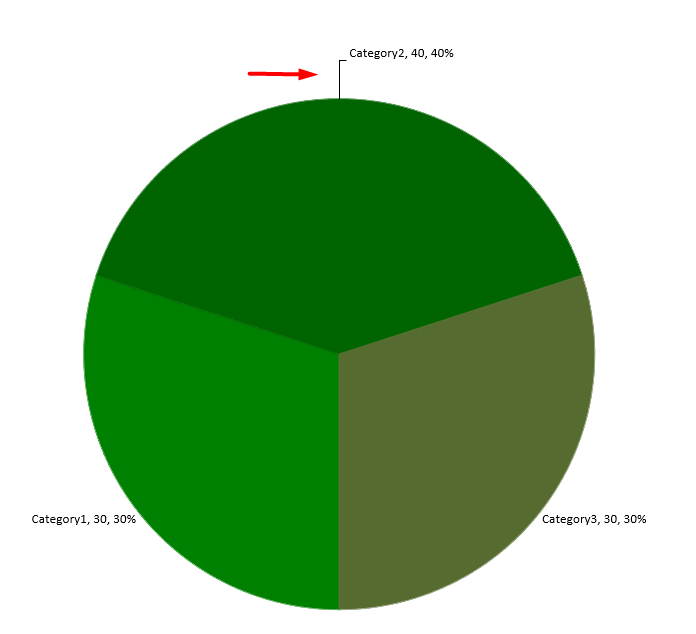
في مخطط دائري، اضبط مواضع تسميات البيانات لتحسين التباعد وتوفير مساحة لخطوط القادة.
يعرض هذا المثال قيمة نقطة البيانات الأولى، يضع تسميتها خارج القطعة، ويستخدم set_X وset_Y لضبط إزاحتها. هذه الإزاحات نسبية إلى عرض المخطط وارتفاعه على التوالي.
#include <DOM/Presentation.h>
#include <DOM/ISlide.h>
#include <DOM/IShapeCollection.h>
#include <DOM/IChart.h>
#include <DOM/Chart/ChartType.h>
#include <DOM/Chart/IChartData.h>
#include <DOM/Chart/IChartSeriesCollection.h>
#include <DOM/Chart/IChartSeries.h>
#include <DOM/Chart/IDataLabel.h>
#include <DOM/Chart/IDataLabelFormat.h>
#include <DOM/Chart/LegendDataLabelPosition.h>
#include <Export/SaveFormat.h>
#include <system/smart_ptr.h>
#include <system/string.h>

using namespace Aspose::Slides;
using namespace Aspose::Slides::Charts;
using namespace Aspose::Slides::Export;
using namespace System;

auto presentation = MakeObject<Presentation>();
auto slide = presentation->get_Slide(0);

auto chart = slide->get_Shapes()->AddChart(ChartType::Pie, 50, 50, 200, 200);
auto series = chart->get_ChartData()->get_Series();

auto label = series->idx_get(0)->get_Label(0);
label->get_DataLabelFormat()->set_ShowValue(true);
label->get_DataLabelFormat()->set_Position(LegendDataLabelPosition::OutsideEnd);
label->set_X(0.71f);
label->set_Y(0.04f);

presentation->Save(u"presentation.pptx", SaveFormat::Pptx);
إضافة عدة صفوف من تسميات البيانات فوق مخطط عمودي
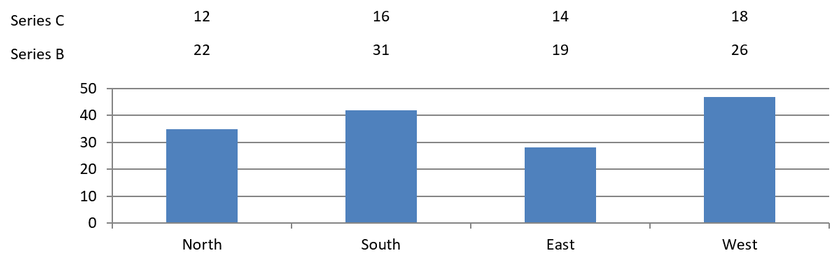
ينشئ هذا المثال مخطط عمود مع صفين من تسميات البيانات فوق مساحة الرسم. تعرض السلسلة A الأعمدة المرئية، بينما توفر السلسلة B والسلسلة C التسميات الإضافية. يتم إخفاء أعمدتها بإزالة التعبئة والحدود. طريقة set_Overlap تُحاذِّ جميع السلاسل الثلاث بمراكز الفئات نفسها.
تُخصص إعدادات get_PlotArea مساحة لصفوف التسميات. بعد أن يحسب ValidateChartLayout المواضع الافتراضية، يُحافظ set_X وset_Y على المحاذاة الأفقية ويطبق إزاحات رأسية لتنظيم التسميات في صفين. الأرقام تظل تسميات بيانات مرتبطة بقيم السلسلة؛ فقط عناوين الصفوف هي أشكال نصية منفصلة.
#include <DOM/Presentation.h>
#include <DOM/ISlide.h>
#include <DOM/IShapeCollection.h>
#include <DOM/IChart.h>
#include <DOM/Chart/ChartType.h>
#include <DOM/Chart/IChartData.h>
#include <DOM/Chart/IChartCategoryCollection.h>
#include <DOM/Chart/IChartDataWorkbook.h>
#include <DOM/Chart/IChartDataCell.h>
#include <DOM/Chart/IChartSeriesCollection.h>
#include <DOM/Chart/IChartSeries.h>
#include <DOM/Chart/IChartDataPointCollection.h>
#include <DOM/Chart/IChartDataPoint.h>
#include <DOM/Chart/IChartSeriesGroup.h>
#include <DOM/Chart/IFormat.h>
#include <DOM/Chart/IDataLabelCollection.h>
#include <DOM/Chart/IDataLabelFormat.h>
#include <DOM/Chart/IDataLabel.h>
#include <DOM/Chart/IChartTextFormat.h>
#include <DOM/Chart/IChartPortionFormat.h>
#include <DOM/Chart/LegendDataLabelPosition.h>
#include <DOM/Chart/IAxesManager.h>
#include <DOM/Chart/IAxis.h>
#include <DOM/Chart/IChartPlotArea.h>
#include <DOM/Chart/LayoutTargetType.h>
#include <DOM/FillType.h>
#include <DOM/IFillFormat.h>
#include <DOM/ILineFormat.h>
#include <DOM/IColorFormat.h>
#include <DOM/ShapeType.h>
#include <DOM/IAutoShape.h>
#include <DOM/ITextFrame.h>
#include <DOM/ITextFrameFormat.h>
#include <DOM/IParagraphCollection.h>
#include <DOM/IParagraph.h>
#include <DOM/IPortionCollection.h>
#include <DOM/IPortion.h>
#include <DOM/IPortionFormat.h>
#include <Export/SaveFormat.h>
#include <drawing/color.h>
#include <system/object_ext.h>
#include <system/smart_ptr.h>
#include <system/string.h>

using namespace Aspose::Slides;
using namespace Aspose::Slides::Charts;
using namespace Aspose::Slides::Export;
using namespace System;
using namespace System::Drawing;

auto presentation = MakeObject<Presentation>();
auto slide = presentation->get_Slide(0);

auto chart = slide->get_Shapes()->AddChart(ChartType::ClusteredColumn, 40, 40, 640, 200);
chart->set_HasTitle(false);
chart->set_HasLegend(false);
chart->get_TextFormat()->get_PortionFormat()->set_FontHeight(12);

chart->get_ChartData()->get_Series()->Clear();
chart->get_ChartData()->get_Categories()->Clear();

auto workbook = chart->get_ChartData()->get_ChartDataWorkbook();
workbook->Clear(0);

String categories[] = { u"North", u"South", u"East", u"West" };
String seriesNames[] = { u"Series A", u"Series B", u"Series C" };
double seriesValues[3][4] = {
    { 35, 42, 28, 47 },
    { 22, 31, 19, 26 },
    { 12, 16, 14, 18 }
};

for (auto categoryIndex = 0; categoryIndex < 4; categoryIndex++)
{
    auto categoryCell = workbook->GetCell(0, categoryIndex + 1, 0, ObjectExt::Box(categories[categoryIndex]));
    chart->get_ChartData()->get_Categories()->Add(categoryCell);
}

for (auto seriesIndex = 0; seriesIndex < 3; seriesIndex++)
{
    auto seriesCell = workbook->GetCell(0, 0, seriesIndex + 1, ObjectExt::Box(seriesNames[seriesIndex]));
    auto series = chart->get_ChartData()->get_Series()->Add(seriesCell, ChartType::ClusteredColumn);

    for (auto categoryIndex = 0; categoryIndex < 4; categoryIndex++)
    {
        auto valueCell = workbook->GetCell(0, categoryIndex + 1, seriesIndex + 1, ObjectExt::Box(seriesValues[seriesIndex][categoryIndex]));
        series->get_DataPoints()->AddDataPointForBarSeries(valueCell);
    }

    if (seriesIndex > 0)
    {
        // إخفاء أعمدة B و C، ولكن الإبقاء على تسميات البيانات الخاصة بهما.
        series->get_Format()->get_Fill()->set_FillType(FillType::NoFill);
        series->get_Format()->get_Line()->get_FillFormat()->set_FillType(FillType::NoFill);
        auto labelFormat = series->get_Labels()->get_DefaultDataLabelFormat();
        labelFormat->set_ShowValue(true);
        labelFormat->get_TextFormat()->get_PortionFormat()->set_FontHeight(12);
        auto labelFill = labelFormat->get_TextFormat()->get_PortionFormat()->get_FillFormat();
        labelFill->set_FillType(FillType::Solid);
        labelFill->get_SolidFillColor()->set_Color(Color::get_Black());
        labelFormat->set_Position(LegendDataLabelPosition::InsideBase);
    }
}

// محاذاة السلاسل الثلاثة جميعها مع مراكز الفئات نفسها.
chart->get_ChartData()->get_Series()->idx_get(0)->get_ParentSeriesGroup()->set_Overlap(100);

// استخدام خطوط شبكة أقل لهذا المثال المدمج.
chart->get_Axes()->get_VerticalAxis()->set_IsAutomaticMajorUnit(false);
chart->get_Axes()->get_VerticalAxis()->set_MajorUnit(10);

// حجز مساحة فوق منطقة الرسم لصفين من تسميات البيانات.
chart->get_PlotArea()->set_LayoutTargetType(LayoutTargetType::Inner);
chart->get_PlotArea()->set_X(0.15f);
chart->get_PlotArea()->set_Y(0.32f);
chart->get_PlotArea()->set_Width(0.80f);
chart->get_PlotArea()->set_Height(0.48f);
chart->ValidateChartLayout();

for (auto seriesIndex = 1; seriesIndex < 3; seriesIndex++)
{
    auto series = chart->get_ChartData()->get_Series()->idx_get(seriesIndex);
    auto rowTop = seriesIndex == 1 ? 0.15f : 0.03f;

    for (auto categoryIndex = 0; categoryIndex < 4; categoryIndex++)
    {
        auto dataLabel = series->get_DataPoint(categoryIndex)->get_Label();
        // الحفاظ على الموضع الأفقي الافتراضي. Y هو إزاحة من
        // موضع التسمية الافتراضي، معبرًا عنه كجزء من ارتفاع المخطط.
        dataLabel->set_X(0);
        dataLabel->set_Y(rowTop - dataLabel->get_ActualY() / chart->get_Height());
    }

    // العنوان الصفّي هو الشكل النصي المنفصل الوحيد.
    auto rowHeading = slide->get_Shapes()->AddAutoShape(ShapeType::Rectangle, chart->get_X(), chart->get_Y() + rowTop * chart->get_Height(), 85, 18);
    rowHeading->get_FillFormat()->set_FillType(FillType::NoFill);
    rowHeading->get_LineFormat()->get_FillFormat()->set_FillType(FillType::NoFill);
    rowHeading->AddTextFrame(seriesNames[seriesIndex]);
    rowHeading->get_TextFrame()->get_TextFrameFormat()->set_MarginTop(0);
    rowHeading->get_TextFrame()->get_TextFrameFormat()->set_MarginBottom(0);
    auto headingFormat = rowHeading->get_TextFrame()->get_Paragraphs()->idx_get(0)->get_Portions()->idx_get(0)->get_PortionFormat();
    headingFormat->set_FontHeight(12);
    headingFormat->get_FillFormat()->set_FillType(FillType::Solid);
    headingFormat->get_FillFormat()->get_SolidFillColor()->set_Color(Color::get_Black());
}

presentation->Save(u"multiple-rows-of-labels.pptx", SaveFormat::Pptx);
الأسئلة المتكررة
كيف يمكنني منع تداخل تسميات البيانات في المخططات المكتظة؟
اُدمج وضعية التسمية التلقائية، خطوط القادة، وتقليل حجم الخط؛ إذا لزم الأمر، أخفِ بعض الحقول (مثل الفئة) أو اعرض التسميات فقط للقيم القصوى أو النقاط الرئيسة.
كيف يمكنني إلغاء تمكين التسميات للقيم الصفرية أو السلبية أو الفارغة فقط؟
قُم بترشيح نقاط البيانات قبل تفعيل التسميات وأوقف العرض للقيم التي تساوي 0 أو القيم السلبية أو القيم المفقودة وفق قاعدة محددة.
كيف يمكنني ضمان نمط تسمية موحد عند التصدير إلى PDF/صور؟
حدّد عائلة الخط وحجمه صراحةً وتحقق من توفر الخط في بيئة العرض لتجنب الاعتماد على الخط الافتراضي.