
Hantera diagramdataetiketter i presentationer med C++
Introduktion
Dataetiketter visar information om diagramserier och enskilda datapunkter, vilket hjälper läsaren att identifiera värden och förstå diagrammet. Den här artikeln förklarar hur du formaterar värden, visar procent, läser etiketttext, styr etiketter bortom axelns maximum, justerar avståndet mellan kategorinätsetiketter och axeln samt placerar etiketter i ett cirkeldiagram.
Ange dataprecision i diagramdataetiketter
Använd set_NumberFormatOfValues för att formatera serievärden. Detta exempel skapar ett linjediagram med standarddata, visar dess datatabell och aktiverar värdeetiketter för den första serien. Formatet #,##0.00 visar ett tusentalsseparator och två decimaler utan att ändra de underliggande värdena.
#include <DOM/Presentation.h>
#include <DOM/ISlide.h>
#include <DOM/IShapeCollection.h>
#include <DOM/IChart.h>
#include <DOM/Chart/ChartType.h>
#include <DOM/Chart/IChartData.h>
#include <DOM/Chart/IChartSeriesCollection.h>
#include <DOM/Chart/IChartSeries.h>
#include <DOM/Chart/IDataLabelCollection.h>
#include <DOM/Chart/IDataLabelFormat.h>
#include <Export/SaveFormat.h>
#include <system/smart_ptr.h>
#include <system/string.h>

using namespace Aspose::Slides;
using namespace Aspose::Slides::Charts;
using namespace Aspose::Slides::Export;
using namespace System;

auto presentation = MakeObject<Presentation>();
auto slide = presentation->get_Slide(0);

auto chart = slide->get_Shapes()->AddChart(ChartType::Line, 50, 50, 450, 300);
chart->set_HasDataTable(true);

auto series = chart->get_ChartData()->get_Series()->idx_get(0);
series->set_NumberFormatOfValues(u"#,##0.00");
series->get_Labels()->get_DefaultDataLabelFormat()->set_ShowValue(true);

presentation->Save(u"PrecisionOfDatalabels_out.pptx", SaveFormat::Pptx);
Visa procent som etiketter
För ett staplat stapeldiagram beräknas varje värde som en procent av dess kategorisumma och texten tilldelas textramen som returneras av get_TextFrameForOverriding. Detta exempel använder standarddiagramdata och visar procent med två decimaler i en 8‑punkts teckensnitt. Kategorier med totalsumman noll hoppas över för att undvika division med noll. Omdiagramdata ändras måste den anpassade etiketttexten beräknas på nytt.
#include <DOM/Presentation.h>
#include <DOM/ISlide.h>
#include <DOM/IShapeCollection.h>
#include <DOM/IChart.h>
#include <DOM/Chart/ChartType.h>
#include <DOM/Chart/IChartData.h>
#include <DOM/Chart/IChartCategoryCollection.h>
#include <DOM/Chart/IChartSeriesCollection.h>
#include <DOM/Chart/IChartSeries.h>
#include <DOM/Chart/IChartDataPointCollection.h>
#include <DOM/Chart/IChartDataPoint.h>
#include <DOM/Chart/IDoubleChartValue.h>
#include <DOM/Chart/IDataLabel.h>
#include <DOM/Chart/IDataLabelCollection.h>
#include <DOM/Chart/IDataLabelFormat.h>
#include <DOM/Portion.h>
#include <DOM/IPortionFormat.h>
#include <DOM/ITextFrame.h>
#include <DOM/IParagraph.h>
#include <DOM/IParagraphCollection.h>
#include <DOM/IPortionCollection.h>
#include <system/convert.h>
#include <vector>
#include <Export/SaveFormat.h>
#include <system/smart_ptr.h>
#include <system/string.h>

using namespace Aspose::Slides;
using namespace Aspose::Slides::Charts;
using namespace Aspose::Slides::Export;
using namespace System;

auto presentation = MakeObject<Presentation>();
auto slide = presentation->get_Slide(0);

auto chart = slide->get_Shapes()->AddChart(ChartType::StackedColumn, 20, 20, 400, 400);

auto categoryTotals = std::vector<double>(chart->get_ChartData()->get_Categories()->get_Count(), 0.0);
for (auto k = 0; k < chart->get_ChartData()->get_Categories()->get_Count(); k++)
{
    for (auto i = 0; i < chart->get_ChartData()->get_Series()->get_Count(); i++)
    {
        auto series = chart->get_ChartData()->get_Series()->idx_get(i);
        auto pointValue = Convert::ToDouble(series->get_DataPoint(k)->get_Value()->get_Data());
        categoryTotals[k] += pointValue;
    }
}

for (auto x = 0; x < chart->get_ChartData()->get_Series()->get_Count(); x++)
{
    auto series = chart->get_ChartData()->get_Series()->idx_get(x);
    series->get_Labels()->get_DefaultDataLabelFormat()->set_ShowLegendKey(false);

    for (auto j = 0; j < series->get_DataPoints()->get_Count(); j++)
    {
        auto label = series->get_DataPoint(j)->get_Label();
        if (categoryTotals[j] == 0)
        {
            continue;
        }

        auto pointValue = Convert::ToDouble(series->get_DataPoint(j)->get_Value()->get_Data());
        auto dataPointPercent = (pointValue / categoryTotals[j]) * 100;

        auto portion = MakeObject<Portion>();
        portion->set_Text(String::Format(u"{0:F2} %", dataPointPercent));
        portion->get_PortionFormat()->set_FontHeight(8.0f);

        label->get_TextFrameForOverriding()->set_Text(u"");

        auto paragraph = label->get_TextFrameForOverriding()->get_Paragraphs()->idx_get(0);
        paragraph->get_Portions()->Add(portion);

        label->get_DataLabelFormat()->set_ShowValue(true);
        label->get_DataLabelFormat()->set_ShowSeriesName(false);
        label->get_DataLabelFormat()->set_ShowPercentage(false);
        label->get_DataLabelFormat()->set_ShowLegendKey(false);
        label->get_DataLabelFormat()->set_ShowCategoryName(false);
        label->get_DataLabelFormat()->set_ShowBubbleSize(false);
    }
}

presentation->Save(u"DisplayPercentageAsLabels_out.pptx", SaveFormat::Pptx);
Ange procenttecken med diagramdataetiketter
När värden lagras som bråk, använd set_NumberFormat för att visa procent. Skicka false till set_IsNumberFormatLinkedToSource för att tillämpa etikettformatet oberoende av källcellerna.
Detta exempel skapar ett 100 % staplat stapeldiagram med röda och blå serier över fyra kategorier. Varje par av värden summeras till 1. Etikettformatet 0.0% visar 0.30 som 30.0 %, medan den vertikala axeln använder två decimaler. Båda serierna använder vit, 10‑punkts etiketttext.
#include <DOM/Presentation.h>
#include <DOM/ISlide.h>
#include <DOM/IShapeCollection.h>
#include <DOM/IChart.h>
#include <DOM/Chart/ChartType.h>
#include <DOM/Chart/IAxesManager.h>
#include <DOM/Chart/IAxis.h>
#include <DOM/Chart/IChartData.h>
#include <DOM/Chart/IChartCategoryCollection.h>
#include <DOM/Chart/IChartDataWorkbook.h>
#include <DOM/Chart/IChartDataCell.h>
#include <DOM/Chart/IChartSeriesCollection.h>
#include <DOM/Chart/IChartSeries.h>
#include <DOM/Chart/IChartDataPointCollection.h>
#include <DOM/Chart/IFormat.h>
#include <DOM/Chart/IDataLabelCollection.h>
#include <DOM/Chart/IDataLabelFormat.h>
#include <DOM/Chart/IChartTextFormat.h>
#include <DOM/Chart/IChartPortionFormat.h>
#include <DOM/FillType.h>
#include <DOM/IFillFormat.h>
#include <DOM/IColorFormat.h>
#include <drawing/color.h>
#include <system/object_ext.h>
#include <Export/SaveFormat.h>
#include <system/smart_ptr.h>
#include <system/string.h>

using namespace Aspose::Slides;
using namespace Aspose::Slides::Charts;
using namespace Aspose::Slides::Export;
using namespace System;
using namespace System::Drawing;

auto presentation = MakeObject<Presentation>();
auto slide = presentation->get_Slide(0);

auto chart = slide->get_Shapes()->AddChart(ChartType::PercentsStackedColumn, 20, 20, 500, 400);

chart->get_Axes()->get_VerticalAxis()->set_IsNumberFormatLinkedToSource(false);
chart->get_Axes()->get_VerticalAxis()->set_NumberFormat(u"0.00%");

chart->get_ChartData()->get_Series()->Clear();
chart->get_ChartData()->get_Categories()->Clear();

auto workbook = chart->get_ChartData()->get_ChartDataWorkbook();
auto worksheetIndex = 0;
for (auto i = 0; i < 4; i++)
{
    auto categoryCell = workbook->GetCell(worksheetIndex, i + 1, 0, ObjectExt::Box(String::Format(u"Category {0}", i + 1)));
    chart->get_ChartData()->get_Categories()->Add(categoryCell);
}

String seriesNames[] = { u"Reds", u"Blues" };
Color seriesColors[] = { Color::get_Red(), Color::get_Blue() };
double values[2][4] = { { 0.30, 0.50, 0.80, 0.65 }, { 0.70, 0.50, 0.20, 0.35 } };

for (auto i = 0; i < 2; i++)
{
    auto seriesCell = workbook->GetCell(worksheetIndex, 0, i + 1, ObjectExt::Box(seriesNames[i]));
    auto series = chart->get_ChartData()->get_Series()->Add(seriesCell, chart->get_Type());
    for (auto j = 0; j < 4; j++)
    {
        auto valueCell = workbook->GetCell(worksheetIndex, j + 1, i + 1, ObjectExt::Box(values[i][j]));
        series->get_DataPoints()->AddDataPointForBarSeries(valueCell);
    }

    series->get_Format()->get_Fill()->set_FillType(FillType::Solid);
    series->get_Format()->get_Fill()->get_SolidFillColor()->set_Color(seriesColors[i]);

    auto labelFormat = series->get_Labels()->get_DefaultDataLabelFormat();
    labelFormat->set_ShowValue(true);
    labelFormat->set_IsNumberFormatLinkedToSource(false);
    labelFormat->set_NumberFormat(u"0.0%");
    labelFormat->get_TextFormat()->get_PortionFormat()->set_FontHeight(10);
    labelFormat->get_TextFormat()->get_PortionFormat()->get_FillFormat()->set_FillType(FillType::Solid);
    labelFormat->get_TextFormat()->get_PortionFormat()->get_FillFormat()->get_SolidFillColor()->set_Color(Color::get_White());
}

presentation->Save(u"SetDataLabelsPercentageSign_out.pptx", SaveFormat::Pptx);
Läs den faktiska texten för dataetiketter
Använd GetActualLabelText för att hämta den text som produceras av en dataetiketts inställningar. Detta är användbart när etiketter ska extraheras för rapporter, sökas i presentationsinnehåll eller valideras i genererade diagram. I exemplet nedan kombinerar standard‑dataetikettformat varje kategorinamn, serienamn och värde. En punkt formaterar sitt värde som en procent, och en annan använder anpassad text från get_TextFrameForOverriding.
#include <DOM/Presentation.h>
#include <DOM/ISlide.h>
#include <DOM/IShapeCollection.h>
#include <DOM/IChart.h>
#include <DOM/Chart/ChartType.h>
#include <DOM/Chart/IChartData.h>
#include <DOM/Chart/IChartCategoryCollection.h>
#include <DOM/Chart/IChartDataWorkbook.h>
#include <DOM/Chart/IChartDataCell.h>
#include <DOM/Chart/IChartSeriesCollection.h>
#include <DOM/Chart/IChartSeries.h>
#include <DOM/Chart/IChartDataPointCollection.h>
#include <DOM/Chart/IChartDataPoint.h>
#include <DOM/Chart/IDoubleChartValue.h>
#include <DOM/Chart/IDataLabel.h>
#include <DOM/Chart/IDataLabelCollection.h>
#include <DOM/Chart/IDataLabelFormat.h>
#include <DOM/ITextFrame.h>
#include <system/console.h>
#include <system/object_ext.h>
#include <system/smart_ptr.h>
#include <system/string.h>

using namespace Aspose::Slides;
using namespace Aspose::Slides::Charts;
using namespace System;

auto presentation = MakeObject<Presentation>();
auto slide = presentation->get_Slide(0);

auto chart = slide->get_Shapes()->AddChart(ChartType::ClusteredColumn, 20, 20, 500, 300);

chart->get_ChartData()->get_Series()->Clear();
chart->get_ChartData()->get_Categories()->Clear();

auto workbook = chart->get_ChartData()->get_ChartDataWorkbook();
auto firstCategoryCell = workbook->GetCell(0, 1, 0, ObjectExt::Box<String>(u"Q1"));
chart->get_ChartData()->get_Categories()->Add(firstCategoryCell);
auto secondCategoryCell = workbook->GetCell(0, 2, 0, ObjectExt::Box<String>(u"Q2"));
chart->get_ChartData()->get_Categories()->Add(secondCategoryCell);

auto northSeriesCell = workbook->GetCell(0, 0, 1, ObjectExt::Box<String>(u"North"));
auto north = chart->get_ChartData()->get_Series()->Add(northSeriesCell, chart->get_Type());
auto northFirstValueCell = workbook->GetCell(0, 1, 1, ObjectExt::Box(0.25));
north->get_DataPoints()->AddDataPointForBarSeries(northFirstValueCell);
auto northSecondValueCell = workbook->GetCell(0, 2, 1, ObjectExt::Box(0.75));
north->get_DataPoints()->AddDataPointForBarSeries(northSecondValueCell);

auto southSeriesCell = workbook->GetCell(0, 0, 2, ObjectExt::Box<String>(u"South"));
auto south = chart->get_ChartData()->get_Series()->Add(southSeriesCell, chart->get_Type());
auto southFirstValueCell = workbook->GetCell(0, 1, 2, ObjectExt::Box(0.40));
south->get_DataPoints()->AddDataPointForBarSeries(southFirstValueCell);
auto southSecondValueCell = workbook->GetCell(0, 2, 2, ObjectExt::Box(0.60));
south->get_DataPoints()->AddDataPointForBarSeries(southSecondValueCell);

for (auto i = 0; i < chart->get_ChartData()->get_Series()->get_Count(); i++)
{
    auto series = chart->get_ChartData()->get_Series()->idx_get(i);
    auto format = series->get_Labels()->get_DefaultDataLabelFormat();
    format->set_ShowCategoryName(true);
    format->set_ShowSeriesName(true);
    format->set_ShowValue(true);
}

north->get_Label(1)->get_DataLabelFormat()->set_IsNumberFormatLinkedToSource(false);
north->get_Label(1)->get_DataLabelFormat()->set_NumberFormat(u"0%");
south->get_Label(0)->get_TextFrameForOverriding()->set_Text(u"Reviewed");

for (auto i = 0; i < chart->get_ChartData()->get_Series()->get_Count(); i++)
{
    auto series = chart->get_ChartData()->get_Series()->idx_get(i);
    for (auto j = 0; j < series->get_DataPoints()->get_Count(); j++)
    {
        auto point = series->get_DataPoint(j);
        auto label = point->get_Label();
        if (!label->get_IsVisible())
        {
            continue;
        }

        Console::WriteLine(String::Format(u"Value: {0}; label: {1}", point->get_Value()->get_Data(), label->GetActualLabelText()));
    }
}
Det tal som lagras i en datapunkt förblir 0.75, även när dess etikett visar 75 % tillsammans med kategori‑ och serienamn. Anpassad text ersätter den genererade etiketttexten. GetActualLabelText returnerar den resulterande etikettsträngen i båda fallen. Kontrollera get_IsVisible separat, som visas ovan, när du endast vill extrahera synliga etiketter.
Styr dataetiketter bortom axelns maximum
När du begränsar ett axelintervall manuellt kan vissa datapunkter överskrida dess maximum. Använd set_ShowDataLabelsOverMaximum för att styra om deras dataetiketter visas. Denna inställning ändrar etikettens synlighet; den ändrar inte axelns intervall eller de underliggande datavärdena.
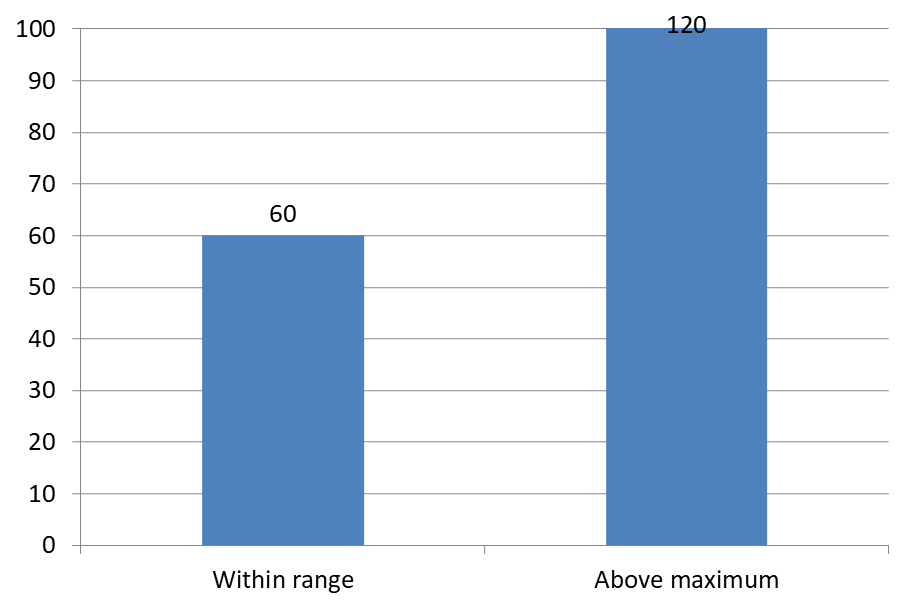
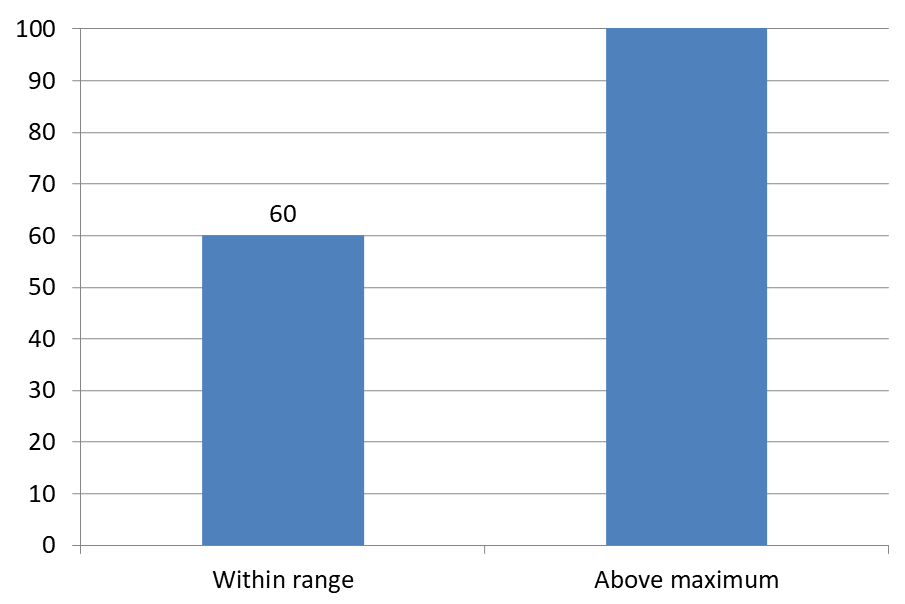
Exemplet nedan skapar ett 2D‑klustrat stapeldiagram med värdena 60 och 120. Det sätter set_IsAutomaticMaxValue till false och set_MaxValue till 100 på den vertikala axeln. Den första bilden tillåter etiketter bortom maximum; en kopia av den bilden inaktiverar dem. Båda bilderna sparas i DataLabelsOverMaximum.pptx.
Aktivera värdeetiketter med set_ShowValue. Diagramnivåinställningen aktiverar inte värdevisning per se och överrider inte en enskild etikett som har inaktiverad värdevisning. Detta exempel aktiverar värden för hela serien och använder set_Position för att placera etiketter vid den yttre kanten av varje kolumn.
#include <DOM/Presentation.h>
#include <DOM/ISlide.h>
#include <DOM/ISlideCollection.h>
#include <DOM/IShapeCollection.h>
#include <DOM/IChart.h>
#include <DOM/Chart/ChartType.h>
#include <DOM/Chart/IAxesManager.h>
#include <DOM/Chart/IAxis.h>
#include <DOM/Chart/IChartData.h>
#include <DOM/Chart/IChartCategoryCollection.h>
#include <DOM/Chart/IChartDataWorkbook.h>
#include <DOM/Chart/IChartDataCell.h>
#include <DOM/Chart/IChartSeriesCollection.h>
#include <DOM/Chart/IChartSeries.h>
#include <DOM/Chart/IChartDataPointCollection.h>
#include <DOM/Chart/IDataLabelCollection.h>
#include <DOM/Chart/IDataLabelFormat.h>
#include <DOM/Chart/LegendDataLabelPosition.h>
#include <Export/SaveFormat.h>
#include <system/object_ext.h>
#include <system/smart_ptr.h>
#include <system/string.h>

using namespace Aspose::Slides;
using namespace Aspose::Slides::Charts;
using namespace Aspose::Slides::Export;
using namespace System;

auto presentation = MakeObject<Presentation>();
auto slide = presentation->get_Slide(0);

auto chart = slide->get_Shapes()->AddChart(ChartType::ClusteredColumn, 50, 50, 600, 400);
chart->set_HasLegend(false);

chart->get_ChartData()->get_Series()->Clear();
chart->get_ChartData()->get_Categories()->Clear();

auto workbook = chart->get_ChartData()->get_ChartDataWorkbook();

auto firstCategory = workbook->GetCell(0, 1, 0, ObjectExt::Box<String>(u"Within range"));
auto secondCategory = workbook->GetCell(0, 2, 0, ObjectExt::Box<String>(u"Above maximum"));

chart->get_ChartData()->get_Categories()->Add(firstCategory);
chart->get_ChartData()->get_Categories()->Add(secondCategory);

auto seriesName = workbook->GetCell(0, 0, 1, ObjectExt::Box<String>(u"Values"));
auto series = chart->get_ChartData()->get_Series()->Add(seriesName, chart->get_Type());

auto firstValue = workbook->GetCell(0, 1, 1, ObjectExt::Box(60));
auto secondValue = workbook->GetCell(0, 2, 1, ObjectExt::Box(120));

series->get_DataPoints()->AddDataPointForBarSeries(firstValue);
series->get_DataPoints()->AddDataPointForBarSeries(secondValue);

series->get_Labels()->get_DefaultDataLabelFormat()->set_ShowValue(true);
series->get_Labels()->get_DefaultDataLabelFormat()->set_Position(LegendDataLabelPosition::OutsideEnd);

chart->get_Axes()->get_VerticalAxis()->set_IsAutomaticMaxValue(false);
chart->get_Axes()->get_VerticalAxis()->set_MaxValue(100);
chart->set_ShowDataLabelsOverMaximum(true);

auto secondSlide = presentation->get_Slides()->AddClone(slide);
auto secondChart = ExplicitCast<IChart>(secondSlide->get_Shape(0));
secondChart->set_ShowDataLabelsOverMaximum(false);

presentation->Save(u"DataLabelsOverMaximum.pptx", SaveFormat::Pptx);
Följande bilder visar de sparade bilderna som renderats av Microsoft PowerPoint. Med true är etiketten 120 synlig vid den övre gränsen; med false är den dold. Etiketten 60 förblir synlig, axelns maximum förblir 100, och den andra datapunkten förblir 120 i båda fallen.
| ShowDataLabelsOverMaximum = true | ShowDataLabelsOverMaximum = false |
|---|---|
 |
 |
Diagramtyp
Detta exempel använder ett 2D‑stapeldiagram med en värdeaxel. Diagram utan värdeaxel, såsom cirkel‑ och doughnut‑diagram, har inget axelmaximum att begränsa på detta sätt.Ange etikettavstånd från en axel
Använd set_LabelOffset för att styra avståndet mellan kategori‑axelns etiketter och själva axeln. Värdet är en procentandel av den maximala teckenstorleken för axelns etiketter. Detta exempel skapar ett klustrat stapeldiagram och sätter den horisontella axelns etikettavstånd till 500. Inställningen påverkar kategori‑axelns etiketter snarare än etiketter som är fästa vid enskilda datapunkter.
#include <DOM/Presentation.h>
#include <DOM/ISlide.h>
#include <DOM/IShapeCollection.h>
#include <DOM/IChart.h>
#include <DOM/Chart/ChartType.h>
#include <DOM/Chart/IAxesManager.h>
#include <DOM/Chart/IAxis.h>
#include <Export/SaveFormat.h>
#include <system/smart_ptr.h>
#include <system/string.h>

using namespace Aspose::Slides;
using namespace Aspose::Slides::Charts;
using namespace Aspose::Slides::Export;
using namespace System;

auto presentation = MakeObject<Presentation>();
auto slide = presentation->get_Slide(0);

auto chart = slide->get_Shapes()->AddChart(ChartType::ClusteredColumn, 20, 20, 500, 300);
chart->get_Axes()->get_HorizontalAxis()->set_LabelOffset(500);

presentation->Save(u"SetCategoryAxisLabelDistance_out.pptx", SaveFormat::Pptx);
Justera etikettplacering
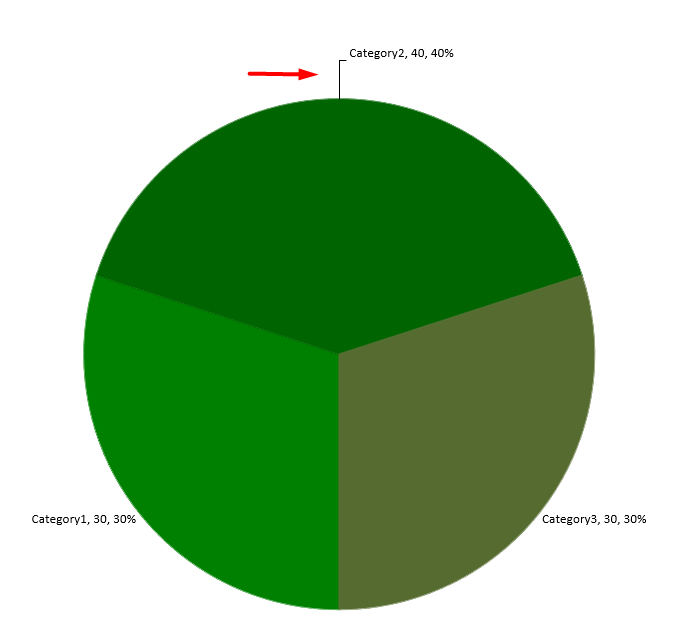
I ett cirkeldiagram justeras dataetikettpositionerna för att förbättra avståndet och ge plats åt ledlinjer.
Detta exempel visar värdet för den första datapunkten, placerar dess etikett utanför sektorn och använder set_X och set_Y för att justera dess offset. Dessa offset är relativa till diagrammets bredd respektive höjd.
#include <DOM/Presentation.h>
#include <DOM/ISlide.h>
#include <DOM/IShapeCollection.h>
#include <DOM/IChart.h>
#include <DOM/Chart/ChartType.h>
#include <DOM/Chart/IChartData.h>
#include <DOM/Chart/IChartSeriesCollection.h>
#include <DOM/Chart/IChartSeries.h>
#include <DOM/Chart/IDataLabel.h>
#include <DOM/Chart/IDataLabelFormat.h>
#include <DOM/Chart/LegendDataLabelPosition.h>
#include <Export/SaveFormat.h>
#include <system/smart_ptr.h>
#include <system/string.h>

using namespace Aspose::Slides;
using namespace Aspose::Slides::Charts;
using namespace Aspose::Slides::Export;
using namespace System;

auto presentation = MakeObject<Presentation>();
auto slide = presentation->get_Slide(0);

auto chart = slide->get_Shapes()->AddChart(ChartType::Pie, 50, 50, 200, 200);
auto series = chart->get_ChartData()->get_Series();

auto label = series->idx_get(0)->get_Label(0);
label->get_DataLabelFormat()->set_ShowValue(true);
label->get_DataLabelFormat()->set_Position(LegendDataLabelPosition::OutsideEnd);
label->set_X(0.71f);
label->set_Y(0.04f);

presentation->Save(u"presentation.pptx", SaveFormat::Pptx);
Lägg till flera rader med dataetiketter ovanför ett stapeldiagram
Detta exempel skapar ett stapeldiagram med två rader av dataetiketter ovanför ritområdet. Serie A visar de synliga kolumnerna, medan Serie B och Serie C tillhandahåller de extra etiketterna. Deras kolumner döljes genom att ta bort fyllning och kontur. Metoden set_Overlap justerar alla tre serier så att de har samma kategoricentra.
Inställningarna för get_PlotArea reserverar utrymme för etikett‑raderna. Efter att ValidateChartLayout beräknat standardpositionerna, bevarar set_X och set_Y den horisontella justeringen och tillämpar vertikala offset för att placera etiketterna i två rader. Siffrorna förblir dataetiketter länkade till serievärdena; endast radrubrikerna är separata textformer.
#include <DOM/Presentation.h>
#include <DOM/ISlide.h>
#include <DOM/IShapeCollection.h>
#include <DOM/IChart.h>
#include <DOM/Chart/ChartType.h>
#include <DOM/Chart/IChartData.h>
#include <DOM/Chart/IChartCategoryCollection.h>
#include <DOM/Chart/IChartDataWorkbook.h>
#include <DOM/Chart/IChartDataCell.h>
#include <DOM/Chart/IChartSeriesCollection.h>
#include <DOM/Chart/IChartSeries.h>
#include <DOM/Chart/IChartDataPointCollection.h>
#include <DOM/Chart/IChartDataPoint.h>
#include <DOM/Chart/IChartSeriesGroup.h>
#include <DOM/Chart/IFormat.h>
#include <DOM/Chart/IDataLabelCollection.h>
#include <DOM/Chart/IDataLabelFormat.h>
#include <DOM/Chart/IDataLabel.h>
#include <DOM/Chart/IChartTextFormat.h>
#include <DOM/Chart/IChartPortionFormat.h>
#include <DOM/Chart/LegendDataLabelPosition.h>
#include <DOM/Chart/IAxesManager.h>
#include <DOM/Chart/IAxis.h>
#include <DOM/Chart/IChartPlotArea.h>
#include <DOM/Chart/LayoutTargetType.h>
#include <DOM/FillType.h>
#include <DOM/IFillFormat.h>
#include <DOM/ILineFormat.h>
#include <DOM/IColorFormat.h>
#include <DOM/ShapeType.h>
#include <DOM/IAutoShape.h>
#include <DOM/ITextFrame.h>
#include <DOM/ITextFrameFormat.h>
#include <DOM/IParagraphCollection.h>
#include <DOM/IParagraph.h>
#include <DOM/IPortionCollection.h>
#include <DOM/IPortion.h>
#include <DOM/IPortionFormat.h>
#include <Export/SaveFormat.h>
#include <drawing/color.h>
#include <system/object_ext.h>
#include <system/smart_ptr.h>
#include <system/string.h>

using namespace Aspose::Slides;
using namespace Aspose::Slides::Charts;
using namespace Aspose::Slides::Export;
using namespace System;
using namespace System::Drawing;

auto presentation = MakeObject<Presentation>();
auto slide = presentation->get_Slide(0);

auto chart = slide->get_Shapes()->AddChart(ChartType::ClusteredColumn, 40, 40, 640, 200);
chart->set_HasTitle(false);
chart->set_HasLegend(false);
chart->get_TextFormat()->get_PortionFormat()->set_FontHeight(12);

chart->get_ChartData()->get_Series()->Clear();
chart->get_ChartData()->get_Categories()->Clear();

auto workbook = chart->get_ChartData()->get_ChartDataWorkbook();
workbook->Clear(0);

String categories[] = { u"North", u"South", u"East", u"West" };
String seriesNames[] = { u"Series A", u"Series B", u"Series C" };
double seriesValues[3][4] = {
    { 35, 42, 28, 47 },
    { 22, 31, 19, 26 },
    { 12, 16, 14, 18 }
};

for (auto categoryIndex = 0; categoryIndex < 4; categoryIndex++)
{
    auto categoryCell = workbook->GetCell(0, categoryIndex + 1, 0, ObjectExt::Box(categories[categoryIndex]));
    chart->get_ChartData()->get_Categories()->Add(categoryCell);
}

for (auto seriesIndex = 0; seriesIndex < 3; seriesIndex++)
{
    auto seriesCell = workbook->GetCell(0, 0, seriesIndex + 1, ObjectExt::Box(seriesNames[seriesIndex]));
    auto series = chart->get_ChartData()->get_Series()->Add(seriesCell, ChartType::ClusteredColumn);

    for (auto categoryIndex = 0; categoryIndex < 4; categoryIndex++)
    {
        auto valueCell = workbook->GetCell(0, categoryIndex + 1, seriesIndex + 1, ObjectExt::Box(seriesValues[seriesIndex][categoryIndex]));
        series->get_DataPoints()->AddDataPointForBarSeries(valueCell);
    }

    if (seriesIndex > 0)
    {
        // Dölj kolumnerna för B och C, men behåll deras dataetiketter.
        series->get_Format()->get_Fill()->set_FillType(FillType::NoFill);
        series->get_Format()->get_Line()->get_FillFormat()->set_FillType(FillType::NoFill);
        auto labelFormat = series->get_Labels()->get_DefaultDataLabelFormat();
        labelFormat->set_ShowValue(true);
        labelFormat->get_TextFormat()->get_PortionFormat()->set_FontHeight(12);
        auto labelFill = labelFormat->get_TextFormat()->get_PortionFormat()->get_FillFormat();
        labelFill->set_FillType(FillType::Solid);
        labelFill->get_SolidFillColor()->set_Color(Color::get_Black());
        labelFormat->set_Position(LegendDataLabelPosition::InsideBase);
    }
}

// Justera alla tre serier så att de har samma kategoricentra.
chart->get_ChartData()->get_Series()->idx_get(0)->get_ParentSeriesGroup()->set_Overlap(100);

// Använd färre rutnätlinjer i detta kompakta exempel.
chart->get_Axes()->get_VerticalAxis()->set_IsAutomaticMajorUnit(false);
chart->get_Axes()->get_VerticalAxis()->set_MajorUnit(10);

// Reservera utrymme ovanför diagrammet för två rader med dataetiketter.
chart->get_PlotArea()->set_LayoutTargetType(LayoutTargetType::Inner);
chart->get_PlotArea()->set_X(0.15f);
chart->get_PlotArea()->set_Y(0.32f);
chart->get_PlotArea()->set_Width(0.80f);
chart->get_PlotArea()->set_Height(0.48f);
chart->ValidateChartLayout();

for (auto seriesIndex = 1; seriesIndex < 3; seriesIndex++)
{
    auto series = chart->get_ChartData()->get_Series()->idx_get(seriesIndex);
    auto rowTop = seriesIndex == 1 ? 0.15f : 0.03f;

    for (auto categoryIndex = 0; categoryIndex < 4; categoryIndex++)
    {
        auto dataLabel = series->get_DataPoint(categoryIndex)->get_Label();
        // Behåll standard horisontell position. Y är ett avstånd från
        // standardetikettpositionen, uttryckt som en andel av diagramhöjden.
        dataLabel->set_X(0);
        dataLabel->set_Y(rowTop - dataLabel->get_ActualY() / chart->get_Height());
    }

    // Endast radrubriken är en separat textform.
    auto rowHeading = slide->get_Shapes()->AddAutoShape(ShapeType::Rectangle, chart->get_X(), chart->get_Y() + rowTop * chart->get_Height(), 85, 18);
    rowHeading->get_FillFormat()->set_FillType(FillType::NoFill);
    rowHeading->get_LineFormat()->get_FillFormat()->set_FillType(FillType::NoFill);
    rowHeading->AddTextFrame(seriesNames[seriesIndex]);
    rowHeading->get_TextFrame()->get_TextFrameFormat()->set_MarginTop(0);
    rowHeading->get_TextFrame()->get_TextFrameFormat()->set_MarginBottom(0);
    auto headingFormat = rowHeading->get_TextFrame()->get_Paragraphs()->idx_get(0)->get_Portions()->idx_get(0)->get_PortionFormat();
    headingFormat->set_FontHeight(12);
    headingFormat->get_FillFormat()->set_FillType(FillType::Solid);
    headingFormat->get_FillFormat()->get_SolidFillColor()->set_Color(Color::get_Black());
}

presentation->Save(u"multiple-rows-of-labels.pptx", SaveFormat::Pptx);

FAQ
Hur kan jag förhindra att dataetiketter överlappar i täta diagram?
Kombinera automatisk etikettplacering, ledlinjer och minskad teckenstorlek; vid behov dölja vissa fält (t.ex. kategori) eller visa etiketter endast för extrema värden eller nyckelpunkter.
Hur kan jag inaktivera etiketter endast för noll‑, negativa‑ eller tomma värden?
Filtrera datapunkter innan etiketter aktiveras och stäng av visning för värden som är 0, negativa eller saknas enligt en definierad regel.
Hur kan jag säkerställa en enhetlig etikettstil vid export till PDF/bilder?
Ange uttryckligen teckensnittsfamilj och storlek och verifiera att teckensnittet finns tillgängligt i renderingsmiljön för att undvika fallback.