
จัดการป้ายข้อมูลแผนภูมิในงานนำเสนอด้วย C++
บทนำ
ป้ายข้อมูลแสดงข้อมูลเกี่ยวกับชุดข้อมูลของแผนภูมิและจุดข้อมูลแต่ละจุด ช่วยให้ผู้อ่านระบุค่าและเข้าใจแผนภูมิ บทความนี้อธิบายวิธีการจัดรูปแบบค่า การแสดงเปอร์เซ็นต์ การอ่านข้อความป้าย การควบคุมป้ายที่อยู่นอกค่ามากสุดของแกน การปรับช่องว่างของป้ายแกนประเภท และการกำหนดตำแหน่งป้ายของแผนภูมิวงกลม
ตั้งค่าความแม่นยำของข้อมูลในป้ายแผนภูมิ
ใช้ set_NumberFormatOfValues เพื่อจัดรูปแบบค่าของชุดข้อมูล ตัวอย่างนี้สร้างแผนภูมิเส้นโดยใช้ข้อมูลเริ่มต้น แสดงตารางข้อมูลและเปิดใช้งานป้ายค่าสำหรับชุดแรก รูปแบบ #,##0.00 แสดงตัวคั่นหลักพันและทศนิยมสองตำแหน่งโดยไม่เปลี่ยนค่าพื้นฐาน
#include <DOM/Presentation.h>
#include <DOM/ISlide.h>
#include <DOM/IShapeCollection.h>
#include <DOM/IChart.h>
#include <DOM/Chart/ChartType.h>
#include <DOM/Chart/IChartData.h>
#include <DOM/Chart/IChartSeriesCollection.h>
#include <DOM/Chart/IChartSeries.h>
#include <DOM/Chart/IDataLabelCollection.h>
#include <DOM/Chart/IDataLabelFormat.h>
#include <Export/SaveFormat.h>
#include <system/smart_ptr.h>
#include <system/string.h>

using namespace Aspose::Slides;
using namespace Aspose::Slides::Charts;
using namespace Aspose::Slides::Export;
using namespace System;

auto presentation = MakeObject<Presentation>();
auto slide = presentation->get_Slide(0);

auto chart = slide->get_Shapes()->AddChart(ChartType::Line, 50, 50, 450, 300);
chart->set_HasDataTable(true);

auto series = chart->get_ChartData()->get_Series()->idx_get(0);
series->set_NumberFormatOfValues(u"#,##0.00");
series->get_Labels()->get_DefaultDataLabelFormat()->set_ShowValue(true);

presentation->Save(u"PrecisionOfDatalabels_out.pptx", SaveFormat::Pptx);
แสดงเปอร์เซ็นต์เป็นป้าย
สำหรับแผนภูมิคอลัมน์แบบซ้อนกัน คำนวณค่าของแต่ละรายการเป็นเปอร์เซ็นต์ของผลรวมในหมวดหมู่และกำหนดข้อความให้กับกรอบข้อความที่ส่งกลับโดย get_TextFrameForOverriding. ตัวอย่างนี้ใช้ข้อมูลแผนภูมิโดยค่าเริ่มต้นและแสดงเปอร์เซ็นต์ด้วยทศนิยมสองตำแหน่งโดยใช้ฟอนท์ขนาด 8 จุด หมวดหมู่ที่ผลรวมเป็นศูนย์จะถูกข้ามเพื่อหลีกเลี่ยงการหารด้วยศูนย์ หากข้อมูลแผนภูมิมีการเปลี่ยนแปลงให้คำนวณข้อความป้ายแบบกำหนดใหม่
#include <DOM/Presentation.h>
#include <DOM/ISlide.h>
#include <DOM/IShapeCollection.h>
#include <DOM/IChart.h>
#include <DOM/Chart/ChartType.h>
#include <DOM/Chart/IChartData.h>
#include <DOM/Chart/IChartCategoryCollection.h>
#include <DOM/Chart/IChartSeriesCollection.h>
#include <DOM/Chart/IChartSeries.h>
#include <DOM/Chart/IChartDataPointCollection.h>
#include <DOM/Chart/IChartDataPoint.h>
#include <DOM/Chart/IDoubleChartValue.h>
#include <DOM/Chart/IDataLabel.h>
#include <DOM/Chart/IDataLabelCollection.h>
#include <DOM/Chart/IDataLabelFormat.h>
#include <DOM/Portion.h>
#include <DOM/IPortionFormat.h>
#include <DOM/ITextFrame.h>
#include <DOM/IParagraph.h>
#include <DOM/IParagraphCollection.h>
#include <DOM/IPortionCollection.h>
#include <system/convert.h>
#include <vector>
#include <Export/SaveFormat.h>
#include <system/smart_ptr.h>
#include <system/string.h>

using namespace Aspose::Slides;
using namespace Aspose::Slides::Charts;
using namespace Aspose::Slides::Export;
using namespace System;

auto presentation = MakeObject<Presentation>();
auto slide = presentation->get_Slide(0);

auto chart = slide->get_Shapes()->AddChart(ChartType::StackedColumn, 20, 20, 400, 400);

auto categoryTotals = std::vector<double>(chart->get_ChartData()->get_Categories()->get_Count(), 0.0);
for (auto k = 0; k < chart->get_ChartData()->get_Categories()->get_Count(); k++)
{
    for (auto i = 0; i < chart->get_ChartData()->get_Series()->get_Count(); i++)
    {
        auto series = chart->get_ChartData()->get_Series()->idx_get(i);
        auto pointValue = Convert::ToDouble(series->get_DataPoint(k)->get_Value()->get_Data());
        categoryTotals[k] += pointValue;
    }
}

for (auto x = 0; x < chart->get_ChartData()->get_Series()->get_Count(); x++)
{
    auto series = chart->get_ChartData()->get_Series()->idx_get(x);
    series->get_Labels()->get_DefaultDataLabelFormat()->set_ShowLegendKey(false);

    for (auto j = 0; j < series->get_DataPoints()->get_Count(); j++)
    {
        auto label = series->get_DataPoint(j)->get_Label();
        if (categoryTotals[j] == 0)
        {
            continue;
        }

        auto pointValue = Convert::ToDouble(series->get_DataPoint(j)->get_Value()->get_Data());
        auto dataPointPercent = (pointValue / categoryTotals[j]) * 100;

        auto portion = MakeObject<Portion>();
        portion->set_Text(String::Format(u"{0:F2} %", dataPointPercent));
        portion->get_PortionFormat()->set_FontHeight(8.0f);

        label->get_TextFrameForOverriding()->set_Text(u"");

        auto paragraph = label->get_TextFrameForOverriding()->get_Paragraphs()->idx_get(0);
        paragraph->get_Portions()->Add(portion);

        label->get_DataLabelFormat()->set_ShowValue(true);
        label->get_DataLabelFormat()->set_ShowSeriesName(false);
        label->get_DataLabelFormat()->set_ShowPercentage(false);
        label->get_DataLabelFormat()->set_ShowLegendKey(false);
        label->get_DataLabelFormat()->set_ShowCategoryName(false);
        label->get_DataLabelFormat()->set_ShowBubbleSize(false);
    }
}

presentation->Save(u"DisplayPercentageAsLabels_out.pptx", SaveFormat::Pptx);
ตั้งสัญลักษณ์เปอร์เซ็นต์กับป้ายข้อมูลแผนภูมิ
เมื่อค่าถูกเก็บเป็นส่วนทศนิยม ใช้ set_NumberFormat เพื่อแสดงเปอร์เซ็นต์ ส่งค่า false ไปยัง set_IsNumberFormatLinkedToSource เพื่อให้รูปแบบป้ายทำงานอิสระจากเซลล์ต้นฉบับ
ตัวอย่างนี้สร้างแผนภูมิคอลัมน์แบบซ้อนกัน 100% พร้อมชุดสีแดงและสีน้ำเงินในสี่หมวดหมู่ แต่ละคู่ของค่าจะรวมกันเป็น 1 รูปแบบป้าย 0.0% แสดง 0.30 เป็น 30.0% ในขณะที่แกนแนวตั้งใช้ทศนิยมสองตำแหน่ง ทั้งสองชุดใช้ข้อความป้ายสีขาว ขนาด 10 จุด
#include <DOM/Presentation.h>
#include <DOM/ISlide.h>
#include <DOM/IShapeCollection.h>
#include <DOM/IChart.h>
#include <DOM/Chart/ChartType.h>
#include <DOM/Chart/IAxesManager.h>
#include <DOM/Chart/IAxis.h>
#include <DOM/Chart/IChartData.h>
#include <DOM/Chart/IChartCategoryCollection.h>
#include <DOM/Chart/IChartDataWorkbook.h>
#include <DOM/Chart/IChartDataCell.h>
#include <DOM/Chart/IChartSeriesCollection.h>
#include <DOM/Chart/IChartSeries.h>
#include <DOM/Chart/IChartDataPointCollection.h>
#include <DOM/Chart/IFormat.h>
#include <DOM/Chart/IDataLabelCollection.h>
#include <DOM/Chart/IDataLabelFormat.h>
#include <DOM/Chart/IChartTextFormat.h>
#include <DOM/Chart/IChartPortionFormat.h>
#include <DOM/FillType.h>
#include <DOM/IFillFormat.h>
#include <DOM/IColorFormat.h>
#include <drawing/color.h>
#include <system/object_ext.h>
#include <Export/SaveFormat.h>
#include <system/smart_ptr.h>
#include <system/string.h>

using namespace Aspose::Slides;
using namespace Aspose::Slides::Charts;
using namespace Aspose::Slides::Export;
using namespace System;
using namespace System::Drawing;

auto presentation = MakeObject<Presentation>();
auto slide = presentation->get_Slide(0);

auto chart = slide->get_Shapes()->AddChart(ChartType::PercentsStackedColumn, 20, 20, 500, 400);

chart->get_Axes()->get_VerticalAxis()->set_IsNumberFormatLinkedToSource(false);
chart->get_Axes()->get_VerticalAxis()->set_NumberFormat(u"0.00%");

chart->get_ChartData()->get_Series()->Clear();
chart->get_ChartData()->get_Categories()->Clear();

auto workbook = chart->get_ChartData()->get_ChartDataWorkbook();
auto worksheetIndex = 0;
for (auto i = 0; i < 4; i++)
{
    auto categoryCell = workbook->GetCell(worksheetIndex, i + 1, 0, ObjectExt::Box(String::Format(u"Category {0}", i + 1)));
    chart->get_ChartData()->get_Categories()->Add(categoryCell);
}

String seriesNames[] = { u"Reds", u"Blues" };
Color seriesColors[] = { Color::get_Red(), Color::get_Blue() };
double values[2][4] = { { 0.30, 0.50, 0.80, 0.65 }, { 0.70, 0.50, 0.20, 0.35 } };

for (auto i = 0; i < 2; i++)
{
    auto seriesCell = workbook->GetCell(worksheetIndex, 0, i + 1, ObjectExt::Box(seriesNames[i]));
    auto series = chart->get_ChartData()->get_Series()->Add(seriesCell, chart->get_Type());
    for (auto j = 0; j < 4; j++)
    {
        auto valueCell = workbook->GetCell(worksheetIndex, j + 1, i + 1, ObjectExt::Box(values[i][j]));
        series->get_DataPoints()->AddDataPointForBarSeries(valueCell);
    }

    series->get_Format()->get_Fill()->set_FillType(FillType::Solid);
    series->get_Format()->get_Fill()->get_SolidFillColor()->set_Color(seriesColors[i]);

    auto labelFormat = series->get_Labels()->get_DefaultDataLabelFormat();
    labelFormat->set_ShowValue(true);
    labelFormat->set_IsNumberFormatLinkedToSource(false);
    labelFormat->set_NumberFormat(u"0.0%");
    labelFormat->get_TextFormat()->get_PortionFormat()->set_FontHeight(10);
    labelFormat->get_TextFormat()->get_PortionFormat()->get_FillFormat()->set_FillType(FillType::Solid);
    labelFormat->get_TextFormat()->get_PortionFormat()->get_FillFormat()->get_SolidFillColor()->set_Color(Color::get_White());
}

presentation->Save(u"SetDataLabelsPercentageSign_out.pptx", SaveFormat::Pptx);
อ่านข้อความจริงของป้ายข้อมูล
ใช้ GetActualLabelText เพื่อรับข้อความที่สร้างโดยการตั้งค่าป้ายข้อมูล ซึ่งเป็นประโยชน์เมื่อดึงป้ายสำหรับรายงาน ค้นหาเนื้อหาในงานนำเสนอ หรือยืนยันความถูกต้องของแผนภูมิที่สร้าง ตัวอย่างด้านล่าง รูปแบบ ป้ายข้อมูลเริ่มต้น รวมชื่อหมวดหมู่ ชื่อชุดข้อมูล และค่า จุดหนึ่งจัดรูปค่าของมันเป็นเปอร์เซ็นต์ และอีกจุดหนึ่งใช้ข้อความกำหนดเองจาก get_TextFrameForOverriding
#include <DOM/Presentation.h>
#include <DOM/ISlide.h>
#include <DOM/IShapeCollection.h>
#include <DOM/IChart.h>
#include <DOM/Chart/ChartType.h>
#include <DOM/Chart/IChartData.h>
#include <DOM/Chart/IChartCategoryCollection.h>
#include <DOM/Chart/IChartDataWorkbook.h>
#include <DOM/Chart/IChartDataCell.h>
#include <DOM/Chart/IChartSeriesCollection.h>
#include <DOM/Chart/IChartSeries.h>
#include <DOM/Chart/IChartDataPointCollection.h>
#include <DOM/Chart/IChartDataPoint.h>
#include <DOM/Chart/IDoubleChartValue.h>
#include <DOM/Chart/IDataLabel.h>
#include <DOM/Chart/IDataLabelCollection.h>
#include <DOM/Chart/IDataLabelFormat.h>
#include <DOM/ITextFrame.h>
#include <system/console.h>
#include <system/object_ext.h>
#include <system/smart_ptr.h>
#include <system/string.h>

using namespace Aspose::Slides;
using namespace Aspose::Slides::Charts;
using namespace System;

auto presentation = MakeObject<Presentation>();
auto slide = presentation->get_Slide(0);

auto chart = slide->get_Shapes()->AddChart(ChartType::ClusteredColumn, 20, 20, 500, 300);

chart->get_ChartData()->get_Series()->Clear();
chart->get_ChartData()->get_Categories()->Clear();

auto workbook = chart->get_ChartData()->get_ChartDataWorkbook();
auto firstCategoryCell = workbook->GetCell(0, 1, 0, ObjectExt::Box<String>(u"Q1"));
chart->get_ChartData()->get_Categories()->Add(firstCategoryCell);
auto secondCategoryCell = workbook->GetCell(0, 2, 0, ObjectExt::Box<String>(u"Q2"));
chart->get_ChartData()->get_Categories()->Add(secondCategoryCell);

auto northSeriesCell = workbook->GetCell(0, 0, 1, ObjectExt::Box<String>(u"North"));
auto north = chart->get_ChartData()->get_Series()->Add(northSeriesCell, chart->get_Type());
auto northFirstValueCell = workbook->GetCell(0, 1, 1, ObjectExt::Box(0.25));
north->get_DataPoints()->AddDataPointForBarSeries(northFirstValueCell);
auto northSecondValueCell = workbook->GetCell(0, 2, 1, ObjectExt::Box(0.75));
north->get_DataPoints()->AddDataPointForBarSeries(northSecondValueCell);

auto southSeriesCell = workbook->GetCell(0, 0, 2, ObjectExt::Box<String>(u"South"));
auto south = chart->get_ChartData()->get_Series()->Add(southSeriesCell, chart->get_Type());
auto southFirstValueCell = workbook->GetCell(0, 1, 2, ObjectExt::Box(0.40));
south->get_DataPoints()->AddDataPointForBarSeries(southFirstValueCell);
auto southSecondValueCell = workbook->GetCell(0, 2, 2, ObjectExt::Box(0.60));
south->get_DataPoints()->AddDataPointForBarSeries(southSecondValueCell);

for (auto i = 0; i < chart->get_ChartData()->get_Series()->get_Count(); i++)
{
    auto series = chart->get_ChartData()->get_Series()->idx_get(i);
    auto format = series->get_Labels()->get_DefaultDataLabelFormat();
    format->set_ShowCategoryName(true);
    format->set_ShowSeriesName(true);
    format->set_ShowValue(true);
}

north->get_Label(1)->get_DataLabelFormat()->set_IsNumberFormatLinkedToSource(false);
north->get_Label(1)->get_DataLabelFormat()->set_NumberFormat(u"0%");
south->get_Label(0)->get_TextFrameForOverriding()->set_Text(u"Reviewed");

for (auto i = 0; i < chart->get_ChartData()->get_Series()->get_Count(); i++)
{
    auto series = chart->get_ChartData()->get_Series()->idx_get(i);
    for (auto j = 0; j < series->get_DataPoints()->get_Count(); j++)
    {
        auto point = series->get_DataPoint(j);
        auto label = point->get_Label();
        if (!label->get_IsVisible())
        {
            continue;
        }

        Console::WriteLine(String::Format(u"Value: {0}; label: {1}", point->get_Value()->get_Data(), label->GetActualLabelText()));
    }
}
จำนวนที่เก็บในจุดข้อมูลยังคงเป็น 0.75 แม้ว่าป้ายของมันจะแสดง 75% พร้อมชื่อหมวดหมู่และชุดข้อมูล ข้อความกำหนดเองแทนที่ข้อความป้ายที่สร้างขึ้น GetActualLabelText จะส่งคืนสตริงป้ายที่ได้ในทั้งสองกรณี ตรวจสอบ get_IsVisible แยกต่างหากตามที่แสดงข้างต้นเมื่อคุณต้องการดึงเฉพาะป้ายที่มองเห็นได้
ควบคุมป้ายข้อมูลที่เกินค่าสูงสุดของแกน
เมื่อคุณกำหนดช่วงแกนด้วยตนเอง บางจุดข้อมูลอาจเกินค่าสูงสุดของแกน ใช้ set_ShowDataLabelsOverMaximum เพื่อควบคุมว่าป้ายข้อมูลของพวกมันจะแสดงหรือไม่ การตั้งค่านี้เปลี่ยนการมองเห็นของป้าย; ไม่เปลี่ยนช่วงแกนหรือค่าพื้นฐานของข้อมูล
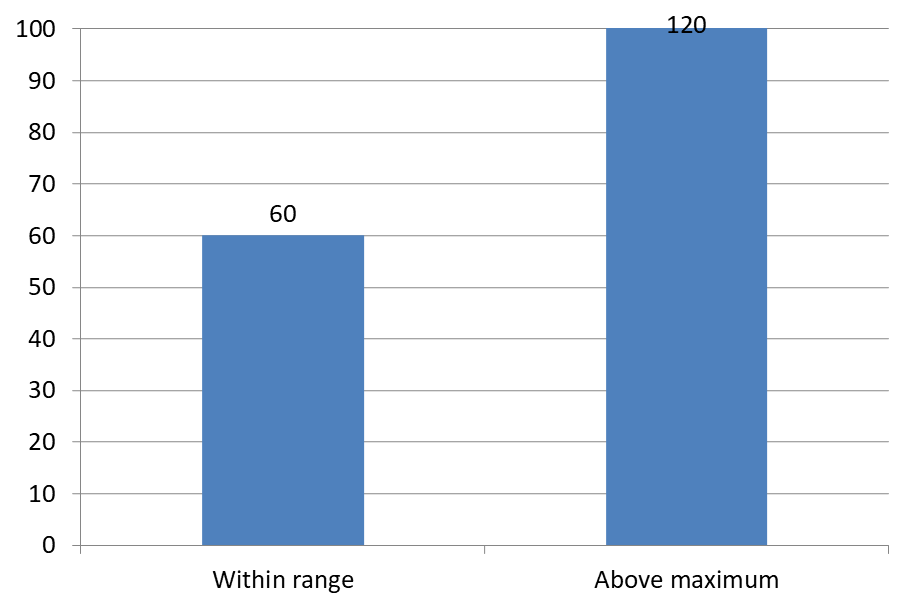
ตัวอย่างด้านล่างสร้างแผนภูมิคอลัมน์แบบกลุ่ม 2 มิติที่มีค่า 60 และ 120 ตั้งค่า set_IsAutomaticMaxValue เป็น false และ set_MaxValue เป็น 100 บนแกนแนวตั้ง สไลด์แรกอนุญาตให้ป้ายแสดงเกินค่าสูงสุด; สไลด์สำเนาของสไลด์นั้นปิดการแสดงผล ทั้งสองสไลด์บันทึกเป็น DataLabelsOverMaximum.pptx
เปิดใช้งานป้ายค่าโดยใช้ set_ShowValue. การตั้งค่าระดับแผนภูมิไม่ทำให้ค่าถูกแสดงโดยอัตโนมัติหรือเขียนทับการปิดการแสดงค่าของป้ายแต่ละอัน ตัวอย่างนี้เปิดใช้งานค่าทั้งชุดและใช้ set_Position เพื่อวางป้ายที่ด้านนอกของคอลัมน์แต่ละคอลัมน์
#include <DOM/Presentation.h>
#include <DOM/ISlide.h>
#include <DOM/ISlideCollection.h>
#include <DOM/IShapeCollection.h>
#include <DOM/IChart.h>
#include <DOM/Chart/ChartType.h>
#include <DOM/Chart/IAxesManager.h>
#include <DOM/Chart/IAxis.h>
#include <DOM/Chart/IChartData.h>
#include <DOM/Chart/IChartCategoryCollection.h>
#include <DOM/Chart/IChartDataWorkbook.h>
#include <DOM/Chart/IChartDataCell.h>
#include <DOM/Chart/IChartSeriesCollection.h>
#include <DOM/Chart/IChartSeries.h>
#include <DOM/Chart/IChartDataPointCollection.h>
#include <DOM/Chart/IDataLabelCollection.h>
#include <DOM/Chart/IDataLabelFormat.h>
#include <DOM/Chart/LegendDataLabelPosition.h>
#include <Export/SaveFormat.h>
#include <system/object_ext.h>
#include <system/smart_ptr.h>
#include <system/string.h>

using namespace Aspose::Slides;
using namespace Aspose::Slides::Charts;
using namespace Aspose::Slides::Export;
using namespace System;

auto presentation = MakeObject<Presentation>();
auto slide = presentation->get_Slide(0);

auto chart = slide->get_Shapes()->AddChart(ChartType::ClusteredColumn, 50, 50, 600, 400);
chart->set_HasLegend(false);

chart->get_ChartData()->get_Series()->Clear();
chart->get_ChartData()->get_Categories()->Clear();

auto workbook = chart->get_ChartData()->get_ChartDataWorkbook();

auto firstCategory = workbook->GetCell(0, 1, 0, ObjectExt::Box<String>(u"Within range"));
auto secondCategory = workbook->GetCell(0, 2, 0, ObjectExt::Box<String>(u"Above maximum"));

chart->get_ChartData()->get_Categories()->Add(firstCategory);
chart->get_ChartData()->get_Categories()->Add(secondCategory);

auto seriesName = workbook->GetCell(0, 0, 1, ObjectExt::Box<String>(u"Values"));
auto series = chart->get_ChartData()->get_Series()->Add(seriesName, chart->get_Type());

auto firstValue = workbook->GetCell(0, 1, 1, ObjectExt::Box(60));
auto secondValue = workbook->GetCell(0, 2, 1, ObjectExt::Box(120));

series->get_DataPoints()->AddDataPointForBarSeries(firstValue);
series->get_DataPoints()->AddDataPointForBarSeries(secondValue);

series->get_Labels()->get_DefaultDataLabelFormat()->set_ShowValue(true);
series->get_Labels()->get_DefaultDataLabelFormat()->set_Position(LegendDataLabelPosition::OutsideEnd);

chart->get_Axes()->get_VerticalAxis()->set_IsAutomaticMaxValue(false);
chart->get_Axes()->get_VerticalAxis()->set_MaxValue(100);
chart->set_ShowDataLabelsOverMaximum(true);

auto secondSlide = presentation->get_Slides()->AddClone(slide);
auto secondChart = ExplicitCast<IChart>(secondSlide->get_Shape(0));
secondChart->set_ShowDataLabelsOverMaximum(false);

presentation->Save(u"DataLabelsOverMaximum.pptx", SaveFormat::Pptx);
ภาพต่อไปนี้แสดงสไลด์ที่บันทึกและเรนเดอร์โดย Microsoft PowerPoint ด้วยค่า true ป้าย 120 จะมองเห็นได้ที่ขอบบน; ด้วยค่า false ป้ายจะถูกซ่อน ป้าย 60 ยังคงมองเห็นได้ ค่าสูงสุดของแกนคงที่ที่ 100 และจุดข้อมูลที่สองยังคงเป็น 120 ในทั้งสองกรณี
| ShowDataLabelsOverMaximum = true | ShowDataLabelsOverMaximum = false |
|---|---|
 |
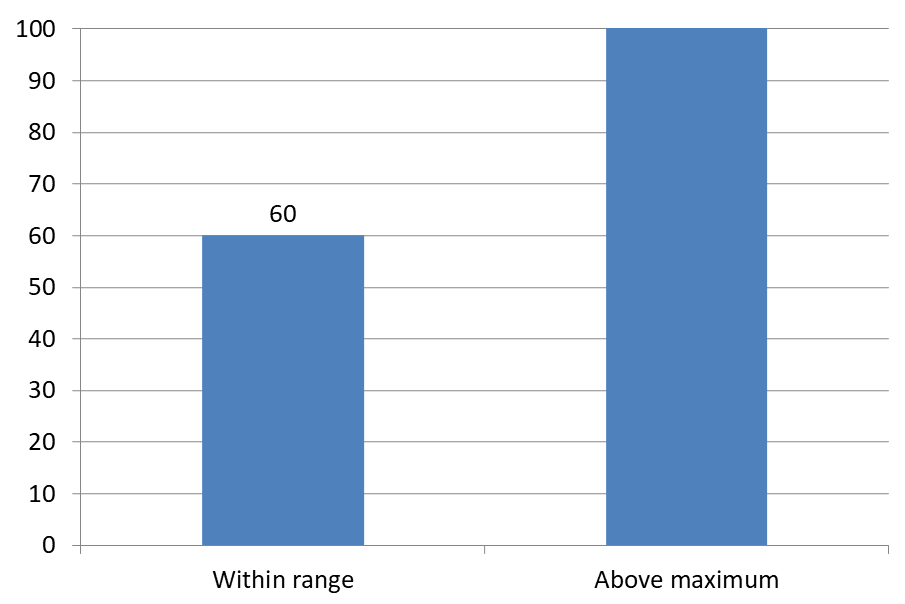 |
Chart Type
ตัวอย่างนี้ใช้แผนภูมิคอลัมน์ 2 มิติพร้อมแกนค่า แผนภูมิที่ไม่มีแกนค่า เช่น แผนภูมิวงกลมและโดนัท จะไม่มีค่าสูงสุดของแกนเพื่อจำกัดในลักษณะนี้ตั้งค่าระยะห่างของป้ายจากแกน
ใช้ set_LabelOffset เพื่อควบคุมระยะห่างระหว่างป้ายแกนประเภทและแกน ค่านี้เป็นเปอร์เซ็นต์ของขนาดฟอนท์สูงสุดของป้ายแกน ตัวอย่างนี้สร้างแผนภูมิคอลัมน์แบบกลุ่มและตั้งค่าการเลื่อนป้ายแกนแนวนอนเป็น 500 การตั้งค่านี้ส่งผลต่อป้ายแกนประเภท ไม่ใช่ป้ายที่เชื่อมกับจุดข้อมูลแต่ละจุด
#include <DOM/Presentation.h>
#include <DOM/ISlide.h>
#include <DOM/IShapeCollection.h>
#include <DOM/IChart.h>
#include <DOM/Chart/ChartType.h>
#include <DOM/Chart/IAxesManager.h>
#include <DOM/Chart/IAxis.h>
#include <Export/SaveFormat.h>
#include <system/smart_ptr.h>
#include <system/string.h>

using namespace Aspose::Slides;
using namespace Aspose::Slides::Charts;
using namespace Aspose::Slides::Export;
using namespace System;

auto presentation = MakeObject<Presentation>();
auto slide = presentation->get_Slide(0);

auto chart = slide->get_Shapes()->AddChart(ChartType::ClusteredColumn, 20, 20, 500, 300);
chart->get_Axes()->get_HorizontalAxis()->set_LabelOffset(500);

presentation->Save(u"SetCategoryAxisLabelDistance_out.pptx", SaveFormat::Pptx);
ปรับตำแหน่งป้าย
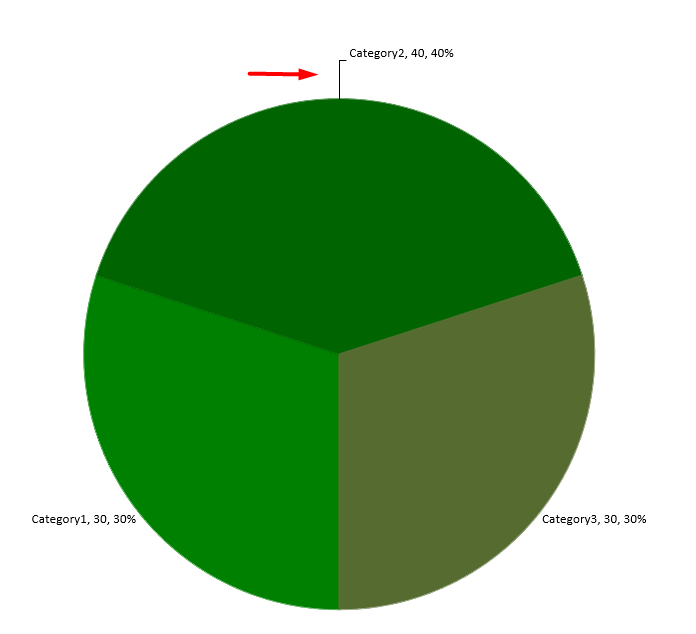
บนแผนภูมิวงกลม ปรับตำแหน่งป้ายข้อมูลเพื่อเพิ่มช่องว่างและให้พื้นที่สำหรับเส้นเชื่อม
ตัวอย่างนี้แสดงค่าของจุดข้อมูลแรก วางป้ายของมันไว้ด้านนอกสไลซ์ และใช้ set_X และ set_Y เพื่อปรับการเลื่อนของมัน การเลื่อนเหล่านี้เป็นค่าที่สัมพันธ์กับความกว้างและความสูงของแผนภูมิ ตามลำดับ
#include <DOM/Presentation.h>
#include <DOM/ISlide.h>
#include <DOM/IShapeCollection.h>
#include <DOM/IChart.h>
#include <DOM/Chart/ChartType.h>
#include <DOM/Chart/IChartData.h>
#include <DOM/Chart/IChartSeriesCollection.h>
#include <DOM/Chart/IChartSeries.h>
#include <DOM/Chart/IDataLabel.h>
#include <DOM/Chart/IDataLabelFormat.h>
#include <DOM/Chart/LegendDataLabelPosition.h>
#include <Export/SaveFormat.h>
#include <system/smart_ptr.h>
#include <system/string.h>

using namespace Aspose::Slides;
using namespace Aspose::Slides::Charts;
using namespace Aspose::Slides::Export;
using namespace System;

auto presentation = MakeObject<Presentation>();
auto slide = presentation->get_Slide(0);

auto chart = slide->get_Shapes()->AddChart(ChartType::Pie, 50, 50, 200, 200);
auto series = chart->get_ChartData()->get_Series();

auto label = series->idx_get(0)->get_Label(0);
label->get_DataLabelFormat()->set_ShowValue(true);
label->get_DataLabelFormat()->set_Position(LegendDataLabelPosition::OutsideEnd);
label->set_X(0.71f);
label->set_Y(0.04f);

presentation->Save(u"presentation.pptx", SaveFormat::Pptx);
คำถามที่พบบ่อย
ฉันจะป้องกันไม่ให้ป้ายข้อมูลทับซ้อนกันในแผนภูมิที่หนาแน่นได้อย่างไร?
ผสานการวางป้ายอัตโนมัติ, เส้นเชื่อม, และลดขนาดฟอนท์; หากจำเป็นให้ซ่อนบางฟิลด์ (เช่น หมวดหมู่) หรือแสดงป้ายเฉพาะค่าที่สุดหรือจุดสำคัญเท่านั้น
ฉันจะปิดการแสดงป้ายเฉพาะค่าศูนย์, ค่าลบ, หรือค่าที่ไม่มีข้อมูลได้อย่างไร?
กรองจุดข้อมูลก่อนเปิดใช้งานป้าย และปิดการแสดงสำหรับค่าที่เป็น 0, ค่าลบ, หรือค่าที่ขาดหายไปตามกฎที่กำหนด
ฉันจะทำให้สไตล์ของป้ายคงที่เมื่อส่งออกเป็น PDF/รูปภาพได้อย่างไร?
กำหนดแบบอักษรและขนาดฟอนท์อย่างชัดเจนและตรวจสอบว่าฟอนท์มีอยู่ในสภาพแวดล้อมการเรนเดอร์เพื่อหลีกเลี่ยงการใช้ฟอนท์สำรอง