
Kelola Label Data Diagram dalam Presentasi Menggunakan C++
Pendahuluan
Label data menampilkan informasi tentang seri diagram dan titik data individu, membantu pembaca mengidentifikasi nilai dan memahami diagram. Artikel ini menjelaskan cara memformat nilai, menampilkan persentase, membaca teks label, mengontrol label di luar maksimum sumbu, menyesuaikan jarak label sumbu kategori, dan memposisikan label diagram pai.
Atur Presisi Data dalam Label Data Diagram
Gunakan set_NumberFormatOfValues untuk memformat nilai seri. Contoh ini membuat diagram garis dengan data default, menampilkan tabel datanya, dan mengaktifkan label nilai untuk seri pertama. Format #,##0.00 menampilkan pemisah ribuan dan dua desimal tanpa mengubah nilai dasar.
#include <DOM/Presentation.h>
#include <DOM/ISlide.h>
#include <DOM/IShapeCollection.h>
#include <DOM/IChart.h>
#include <DOM/Chart/ChartType.h>
#include <DOM/Chart/IChartData.h>
#include <DOM/Chart/IChartSeriesCollection.h>
#include <DOM/Chart/IChartSeries.h>
#include <DOM/Chart/IDataLabelCollection.h>
#include <DOM/Chart/IDataLabelFormat.h>
#include <Export/SaveFormat.h>
#include <system/smart_ptr.h>
#include <system/string.h>

using namespace Aspose::Slides;
using namespace Aspose::Slides::Charts;
using namespace Aspose::Slides::Export;
using namespace System;

auto presentation = MakeObject<Presentation>();
auto slide = presentation->get_Slide(0);

auto chart = slide->get_Shapes()->AddChart(ChartType::Line, 50, 50, 450, 300);
chart->set_HasDataTable(true);

auto series = chart->get_ChartData()->get_Series()->idx_get(0);
series->set_NumberFormatOfValues(u"#,##0.00");
series->get_Labels()->get_DefaultDataLabelFormat()->set_ShowValue(true);

presentation->Save(u"PrecisionOfDatalabels_out.pptx", SaveFormat::Pptx);
Tampilkan Persentase sebagai Label
Untuk diagram kolom bertumpuk, hitung setiap nilai sebagai persentase total kategori dan tetapkan teks ke bingkai teks yang dikembalikan oleh get_TextFrameForOverriding. Contoh ini menggunakan data diagram default dan menampilkan persentase dengan dua desimal dalam ukuran font 8 poin. Kategori dengan total nol dilewati untuk menghindari pembagian dengan nol. Hitung ulang teks label khusus jika data diagram berubah.
#include <DOM/Presentation.h>
#include <DOM/ISlide.h>
#include <DOM/IShapeCollection.h>
#include <DOM/IChart.h>
#include <DOM/Chart/ChartType.h>
#include <DOM/Chart/IChartData.h>
#include <DOM/Chart/IChartCategoryCollection.h>
#include <DOM/Chart/IChartSeriesCollection.h>
#include <DOM/Chart/IChartSeries.h>
#include <DOM/Chart/IChartDataPointCollection.h>
#include <DOM/Chart/IChartDataPoint.h>
#include <DOM/Chart/IDoubleChartValue.h>
#include <DOM/Chart/IDataLabel.h>
#include <DOM/Chart/IDataLabelCollection.h>
#include <DOM/Chart/IDataLabelFormat.h>
#include <DOM/Portion.h>
#include <DOM/IPortionFormat.h>
#include <DOM/ITextFrame.h>
#include <DOM/IParagraph.h>
#include <DOM/IParagraphCollection.h>
#include <DOM/IPortionCollection.h>
#include <system/convert.h>
#include <vector>
#include <Export/SaveFormat.h>
#include <system/smart_ptr.h>
#include <system/string.h>

using namespace Aspose::Slides;
using namespace Aspose::Slides::Charts;
using namespace Aspose::Slides::Export;
using namespace System;

auto presentation = MakeObject<Presentation>();
auto slide = presentation->get_Slide(0);

auto chart = slide->get_Shapes()->AddChart(ChartType::StackedColumn, 20, 20, 400, 400);

auto categoryTotals = std::vector<double>(chart->get_ChartData()->get_Categories()->get_Count(), 0.0);
for (auto k = 0; k < chart->get_ChartData()->get_Categories()->get_Count(); k++)
{
    for (auto i = 0; i < chart->get_ChartData()->get_Series()->get_Count(); i++)
    {
        auto series = chart->get_ChartData()->get_Series()->idx_get(i);
        auto pointValue = Convert::ToDouble(series->get_DataPoint(k)->get_Value()->get_Data());
        categoryTotals[k] += pointValue;
    }
}

for (auto x = 0; x < chart->get_ChartData()->get_Series()->get_Count(); x++)
{
    auto series = chart->get_ChartData()->get_Series()->idx_get(x);
    series->get_Labels()->get_DefaultDataLabelFormat()->set_ShowLegendKey(false);

    for (auto j = 0; j < series->get_DataPoints()->get_Count(); j++)
    {
        auto label = series->get_DataPoint(j)->get_Label();
        if (categoryTotals[j] == 0)
        {
            continue;
        }

        auto pointValue = Convert::ToDouble(series->get_DataPoint(j)->get_Value()->get_Data());
        auto dataPointPercent = (pointValue / categoryTotals[j]) * 100;

        auto portion = MakeObject<Portion>();
        portion->set_Text(String::Format(u"{0:F2} %", dataPointPercent));
        portion->get_PortionFormat()->set_FontHeight(8.0f);

        label->get_TextFrameForOverriding()->set_Text(u"");

        auto paragraph = label->get_TextFrameForOverriding()->get_Paragraphs()->idx_get(0);
        paragraph->get_Portions()->Add(portion);

        label->get_DataLabelFormat()->set_ShowValue(true);
        label->get_DataLabelFormat()->set_ShowSeriesName(false);
        label->get_DataLabelFormat()->set_ShowPercentage(false);
        label->get_DataLabelFormat()->set_ShowLegendKey(false);
        label->get_DataLabelFormat()->set_ShowCategoryName(false);
        label->get_DataLabelFormat()->set_ShowBubbleSize(false);
    }
}

presentation->Save(u"DisplayPercentageAsLabels_out.pptx", SaveFormat::Pptx);
Atur Tanda Persentase dengan Label Data Diagram
Ketika nilai disimpan sebagai pecahan, gunakan set_NumberFormat untuk menampilkan persentase. Berikan false ke set_IsNumberFormatLinkedToSource untuk menerapkan format label secara independen dari sel sumber.
Contoh ini membuat diagram kolom 100% bertumpuk dengan seri merah dan biru di empat kategori. Setiap pasangan nilai menjumlah menjadi 1. Format label 0.0% menampilkan 0.30 sebagai 30.0%, sementara sumbu vertikal menggunakan dua desimal. Kedua seri menggunakan teks label putih berukuran 10 poin.
#include <DOM/Presentation.h>
#include <DOM/ISlide.h>
#include <DOM/IShapeCollection.h>
#include <DOM/IChart.h>
#include <DOM/Chart/ChartType.h>
#include <DOM/Chart/IAxesManager.h>
#include <DOM/Chart/IAxis.h>
#include <DOM/Chart/IChartData.h>
#include <DOM/Chart/IChartCategoryCollection.h>
#include <DOM/Chart/IChartDataWorkbook.h>
#include <DOM/Chart/IChartDataCell.h>
#include <DOM/Chart/IChartSeriesCollection.h>
#include <DOM/Chart/IChartSeries.h>
#include <DOM/Chart/IChartDataPointCollection.h>
#include <DOM/Chart/IFormat.h>
#include <DOM/Chart/IDataLabelCollection.h>
#include <DOM/Chart/IDataLabelFormat.h>
#include <DOM/Chart/IChartTextFormat.h>
#include <DOM/Chart/IChartPortionFormat.h>
#include <DOM/FillType.h>
#include <DOM/IFillFormat.h>
#include <DOM/IColorFormat.h>
#include <drawing/color.h>
#include <system/object_ext.h>
#include <Export/SaveFormat.h>
#include <system/smart_ptr.h>
#include <system/string.h>

using namespace Aspose::Slides;
using namespace Aspose::Slides::Charts;
using namespace Aspose::Slides::Export;
using namespace System;
using namespace System::Drawing;

auto presentation = MakeObject<Presentation>();
auto slide = presentation->get_Slide(0);

auto chart = slide->get_Shapes()->AddChart(ChartType::PercentsStackedColumn, 20, 20, 500, 400);

chart->get_Axes()->get_VerticalAxis()->set_IsNumberFormatLinkedToSource(false);
chart->get_Axes()->get_VerticalAxis()->set_NumberFormat(u"0.00%");

chart->get_ChartData()->get_Series()->Clear();
chart->get_ChartData()->get_Categories()->Clear();

auto workbook = chart->get_ChartData()->get_ChartDataWorkbook();
auto worksheetIndex = 0;
for (auto i = 0; i < 4; i++)
{
    auto categoryCell = workbook->GetCell(worksheetIndex, i + 1, 0, ObjectExt::Box(String::Format(u"Category {0}", i + 1)));
    chart->get_ChartData()->get_Categories()->Add(categoryCell);
}

String seriesNames[] = { u"Reds", u"Blues" };
Color seriesColors[] = { Color::get_Red(), Color::get_Blue() };
double values[2][4] = { { 0.30, 0.50, 0.80, 0.65 }, { 0.70, 0.50, 0.20, 0.35 } };

for (auto i = 0; i < 2; i++)
{
    auto seriesCell = workbook->GetCell(worksheetIndex, 0, i + 1, ObjectExt::Box(seriesNames[i]));
    auto series = chart->get_ChartData()->get_Series()->Add(seriesCell, chart->get_Type());
    for (auto j = 0; j < 4; j++)
    {
        auto valueCell = workbook->GetCell(worksheetIndex, j + 1, i + 1, ObjectExt::Box(values[i][j]));
        series->get_DataPoints()->AddDataPointForBarSeries(valueCell);
    }

    series->get_Format()->get_Fill()->set_FillType(FillType::Solid);
    series->get_Format()->get_Fill()->get_SolidFillColor()->set_Color(seriesColors[i]);

    auto labelFormat = series->get_Labels()->get_DefaultDataLabelFormat();
    labelFormat->set_ShowValue(true);
    labelFormat->set_IsNumberFormatLinkedToSource(false);
    labelFormat->set_NumberFormat(u"0.0%");
    labelFormat->get_TextFormat()->get_PortionFormat()->set_FontHeight(10);
    labelFormat->get_TextFormat()->get_PortionFormat()->get_FillFormat()->set_FillType(FillType::Solid);
    labelFormat->get_TextFormat()->get_PortionFormat()->get_FillFormat()->get_SolidFillColor()->set_Color(Color::get_White());
}

presentation->Save(u"SetDataLabelsPercentageSign_out.pptx", SaveFormat::Pptx);
Baca Teks Aktual Label Data
Gunakan GetActualLabelText untuk mengambil teks yang dihasilkan oleh pengaturan label data. Ini berguna ketika mengekstrak label untuk laporan, mencari konten presentasi, atau memvalidasi diagram yang dihasilkan. Pada contoh di bawah, format label data default menggabungkan setiap nama kategori, nama seri, dan nilai. Satu titik memformat nilainya sebagai persentase, dan titik lain menggunakan teks khusus dari get_TextFrameForOverriding.
#include <DOM/Presentation.h>
#include <DOM/ISlide.h>
#include <DOM/IShapeCollection.h>
#include <DOM/IChart.h>
#include <DOM/Chart/ChartType.h>
#include <DOM/Chart/IChartData.h>
#include <DOM/Chart/IChartCategoryCollection.h>
#include <DOM/Chart/IChartDataWorkbook.h>
#include <DOM/Chart/IChartDataCell.h>
#include <DOM/Chart/IChartSeriesCollection.h>
#include <DOM/Chart/IChartSeries.h>
#include <DOM/Chart/IChartDataPointCollection.h>
#include <DOM/Chart/IChartDataPoint.h>
#include <DOM/Chart/IDoubleChartValue.h>
#include <DOM/Chart/IDataLabel.h>
#include <DOM/Chart/IDataLabelCollection.h>
#include <DOM/Chart/IDataLabelFormat.h>
#include <DOM/ITextFrame.h>
#include <system/console.h>
#include <system/object_ext.h>
#include <system/smart_ptr.h>
#include <system/string.h>

using namespace Aspose::Slides;
using namespace Aspose::Slides::Charts;
using namespace System;

auto presentation = MakeObject<Presentation>();
auto slide = presentation->get_Slide(0);

auto chart = slide->get_Shapes()->AddChart(ChartType::ClusteredColumn, 20, 20, 500, 300);

chart->get_ChartData()->get_Series()->Clear();
chart->get_ChartData()->get_Categories()->Clear();

auto workbook = chart->get_ChartData()->get_ChartDataWorkbook();
auto firstCategoryCell = workbook->GetCell(0, 1, 0, ObjectExt::Box<String>(u"Q1"));
chart->get_ChartData()->get_Categories()->Add(firstCategoryCell);
auto secondCategoryCell = workbook->GetCell(0, 2, 0, ObjectExt::Box<String>(u"Q2"));
chart->get_ChartData()->get_Categories()->Add(secondCategoryCell);

auto northSeriesCell = workbook->GetCell(0, 0, 1, ObjectExt::Box<String>(u"North"));
auto north = chart->get_ChartData()->get_Series()->Add(northSeriesCell, chart->get_Type());
auto northFirstValueCell = workbook->GetCell(0, 1, 1, ObjectExt::Box(0.25));
north->get_DataPoints()->AddDataPointForBarSeries(northFirstValueCell);
auto northSecondValueCell = workbook->GetCell(0, 2, 1, ObjectExt::Box(0.75));
north->get_DataPoints()->AddDataPointForBarSeries(northSecondValueCell);

auto southSeriesCell = workbook->GetCell(0, 0, 2, ObjectExt::Box<String>(u"South"));
auto south = chart->get_ChartData()->get_Series()->Add(southSeriesCell, chart->get_Type());
auto southFirstValueCell = workbook->GetCell(0, 1, 2, ObjectExt::Box(0.40));
south->get_DataPoints()->AddDataPointForBarSeries(southFirstValueCell);
auto southSecondValueCell = workbook->GetCell(0, 2, 2, ObjectExt::Box(0.60));
south->get_DataPoints()->AddDataPointForBarSeries(southSecondValueCell);

for (auto i = 0; i < chart->get_ChartData()->get_Series()->get_Count(); i++)
{
    auto series = chart->get_ChartData()->get_Series()->idx_get(i);
    auto format = series->get_Labels()->get_DefaultDataLabelFormat();
    format->set_ShowCategoryName(true);
    format->set_ShowSeriesName(true);
    format->set_ShowValue(true);
}

north->get_Label(1)->get_DataLabelFormat()->set_IsNumberFormatLinkedToSource(false);
north->get_Label(1)->get_DataLabelFormat()->set_NumberFormat(u"0%");
south->get_Label(0)->get_TextFrameForOverriding()->set_Text(u"Reviewed");

for (auto i = 0; i < chart->get_ChartData()->get_Series()->get_Count(); i++)
{
    auto series = chart->get_ChartData()->get_Series()->idx_get(i);
    for (auto j = 0; j < series->get_DataPoints()->get_Count(); j++)
    {
        auto point = series->get_DataPoint(j);
        auto label = point->get_Label();
        if (!label->get_IsVisible())
        {
            continue;
        }

        Console::WriteLine(String::Format(u"Value: {0}; label: {1}", point->get_Value()->get_Data(), label->GetActualLabelText()));
    }
}
Angka yang tersimpan dalam titik data tetap 0.75, meskipun labelnya menampilkan 75% bersama nama kategori dan seri. Teks khusus menggantikan teks label yang dihasilkan. GetActualLabelText mengembalikan string label yang dihasilkan dalam kedua kasus. Periksa get_IsVisible secara terpisah, seperti yang ditunjukkan di atas, ketika Anda hanya ingin mengekstrak label yang terlihat.
Kendalikan Label Data di Luar Maksimum Sumbu
Ketika Anda membatasi rentang sumbu secara manual, beberapa titik data mungkin melebihi maksimum. Gunakan set_ShowDataLabelsOverMaximum untuk mengontrol apakah label data mereka ditampilkan. Pengaturan ini mengubah visibilitas label; tidak mengubah rentang sumbu atau nilai data dasar.
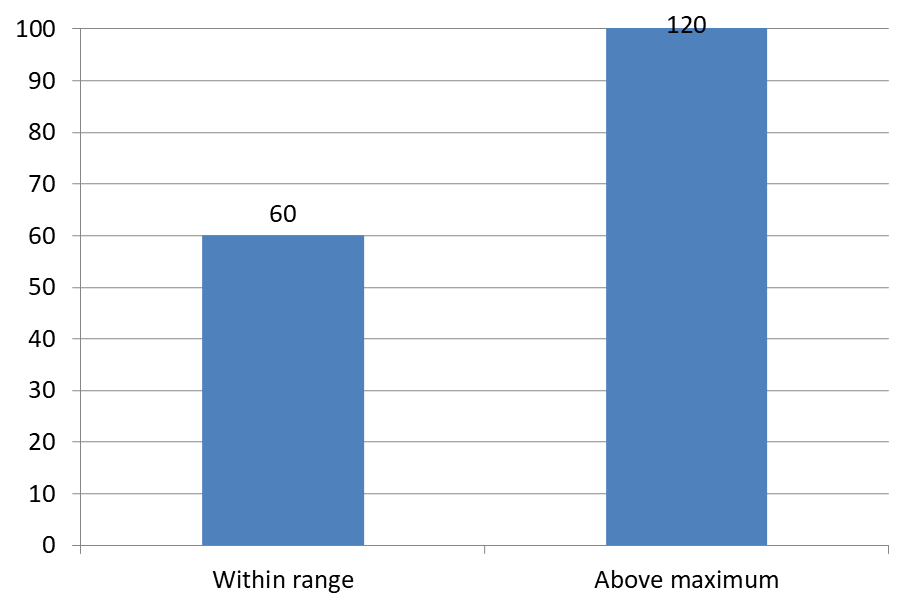
Contoh di bawah membuat diagram kolom berkelompok 2D dengan nilai 60 dan 120. Ia mengatur set_IsAutomaticMaxValue menjadi false dan set_MaxValue menjadi 100 pada sumbu vertikal. Slide pertama memungkinkan label di luar maksimum; salinan slide itu menonaktifkannya. Kedua slide disimpan dalam DataLabelsOverMaximum.pptx.
Aktifkan label nilai dengan set_ShowValue. Pengaturan tingkat diagram tidak mengaktifkan tampilan nilai sendiri atau menimpa penonaktifan tampilan nilai pada label individu. Contoh ini mengaktifkan nilai untuk seluruh seri dan menggunakan set_Position untuk menempatkan label di ujung luar setiap kolom.
#include <DOM/Presentation.h>
#include <DOM/ISlide.h>
#include <DOM/ISlideCollection.h>
#include <DOM/IShapeCollection.h>
#include <DOM/IChart.h>
#include <DOM/Chart/ChartType.h>
#include <DOM/Chart/IAxesManager.h>
#include <DOM/Chart/IAxis.h>
#include <DOM/Chart/IChartData.h>
#include <DOM/Chart/IChartCategoryCollection.h>
#include <DOM/Chart/IChartDataWorkbook.h>
#include <DOM/Chart/IChartDataCell.h>
#include <DOM/Chart/IChartSeriesCollection.h>
#include <DOM/Chart/IChartSeries.h>
#include <DOM/Chart/IChartDataPointCollection.h>
#include <DOM/Chart/IDataLabelCollection.h>
#include <DOM/Chart/IDataLabelFormat.h>
#include <DOM/Chart/LegendDataLabelPosition.h>
#include <Export/SaveFormat.h>
#include <system/object_ext.h>
#include <system/smart_ptr.h>
#include <system/string.h>

using namespace Aspose::Slides;
using namespace Aspose::Slides::Charts;
using namespace Aspose::Slides::Export;
using namespace System;

auto presentation = MakeObject<Presentation>();
auto slide = presentation->get_Slide(0);

auto chart = slide->get_Shapes()->AddChart(ChartType::ClusteredColumn, 50, 50, 600, 400);
chart->set_HasLegend(false);

chart->get_ChartData()->get_Series()->Clear();
chart->get_ChartData()->get_Categories()->Clear();

auto workbook = chart->get_ChartData()->get_ChartDataWorkbook();

auto firstCategory = workbook->GetCell(0, 1, 0, ObjectExt::Box<String>(u"Within range"));
auto secondCategory = workbook->GetCell(0, 2, 0, ObjectExt::Box<String>(u"Above maximum"));

chart->get_ChartData()->get_Categories()->Add(firstCategory);
chart->get_ChartData()->get_Categories()->Add(secondCategory);

auto seriesName = workbook->GetCell(0, 0, 1, ObjectExt::Box<String>(u"Values"));
auto series = chart->get_ChartData()->get_Series()->Add(seriesName, chart->get_Type());

auto firstValue = workbook->GetCell(0, 1, 1, ObjectExt::Box(60));
auto secondValue = workbook->GetCell(0, 2, 1, ObjectExt::Box(120));

series->get_DataPoints()->AddDataPointForBarSeries(firstValue);
series->get_DataPoints()->AddDataPointForBarSeries(secondValue);

series->get_Labels()->get_DefaultDataLabelFormat()->set_ShowValue(true);
series->get_Labels()->get_DefaultDataLabelFormat()->set_Position(LegendDataLabelPosition::OutsideEnd);

chart->get_Axes()->get_VerticalAxis()->set_IsAutomaticMaxValue(false);
chart->get_Axes()->get_VerticalAxis()->set_MaxValue(100);
chart->set_ShowDataLabelsOverMaximum(true);

auto secondSlide = presentation->get_Slides()->AddClone(slide);
auto secondChart = ExplicitCast<IChart>(secondSlide->get_Shape(0));
secondChart->set_ShowDataLabelsOverMaximum(false);

presentation->Save(u"DataLabelsOverMaximum.pptx", SaveFormat::Pptx);
Gambar berikut menunjukkan slide yang disimpan dan dirender oleh Microsoft PowerPoint. Dengan true, label 120 terlihat pada batas atas; dengan false, label tersebut disembunyikan. Label 60 tetap terlihat, maksimum sumbu tetap 100, dan titik data kedua tetap 120 dalam kedua kasus.
| ShowDataLabelsOverMaximum = true | ShowDataLabelsOverMaximum = false |
|---|---|
 |
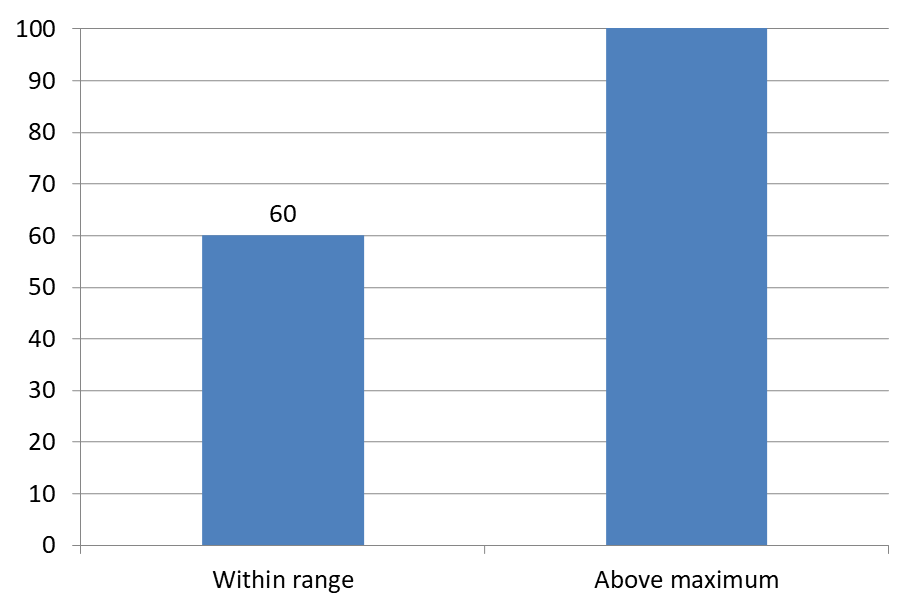 |
Chart Type
Contoh ini menggunakan diagram kolom 2D dengan sumbu nilai. Diagram tanpa sumbu nilai, seperti diagram pai dan donat, tidak memiliki maksimum sumbu yang dapat dibatasi dengan cara ini.Atur Jarak Label dari Sumbu
Gunakan set_LabelOffset untuk mengontrol jarak antara label sumbu kategori dan sumbu. Nilainya merupakan persentase dari ukuran font maksimum label sumbu. Contoh ini membuat diagram kolom berkelompok dan mengatur offset label sumbu horizontal menjadi 500. Pengaturan ini memengaruhi label sumbu kategori, bukan label yang melekat pada titik data individu.
#include <DOM/Presentation.h>
#include <DOM/ISlide.h>
#include <DOM/IShapeCollection.h>
#include <DOM/IChart.h>
#include <DOM/Chart/ChartType.h>
#include <DOM/Chart/IAxesManager.h>
#include <DOM/Chart/IAxis.h>
#include <Export/SaveFormat.h>
#include <system/smart_ptr.h>
#include <system/string.h>

using namespace Aspose::Slides;
using namespace Aspose::Slides::Charts;
using namespace Aspose::Slides::Export;
using namespace System;

auto presentation = MakeObject<Presentation>();
auto slide = presentation->get_Slide(0);

auto chart = slide->get_Shapes()->AddChart(ChartType::ClusteredColumn, 20, 20, 500, 300);
chart->get_Axes()->get_HorizontalAxis()->set_LabelOffset(500);

presentation->Save(u"SetCategoryAxisLabelDistance_out.pptx", SaveFormat::Pptx);
Sesuaikan Lokasi Label
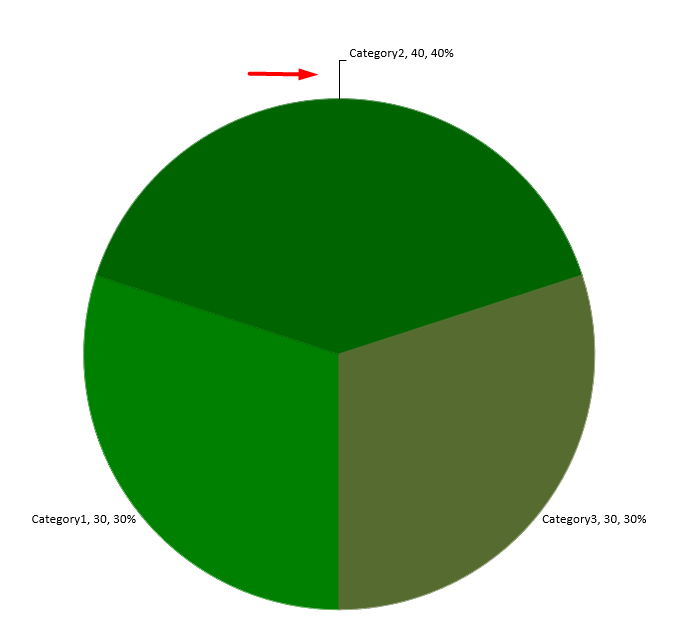
Pada diagram pai, sesuaikan posisi label data untuk memperbaiki jarak dan memberi ruang bagi garis pemimpin.
Contoh ini menampilkan nilai titik data pertama, menempatkan labelnya di luar irisan, dan menggunakan set_X serta set_Y untuk menyesuaikan offsetnya. Offset ini relatif terhadap lebar dan tinggi diagram masing‑masing.
#include <DOM/Presentation.h>
#include <DOM/ISlide.h>
#include <DOM/IShapeCollection.h>
#include <DOM/IChart.h>
#include <DOM/Chart/ChartType.h>
#include <DOM/Chart/IChartData.h>
#include <DOM/Chart/IChartSeriesCollection.h>
#include <DOM/Chart/IChartSeries.h>
#include <DOM/Chart/IDataLabel.h>
#include <DOM/Chart/IDataLabelFormat.h>
#include <DOM/Chart/LegendDataLabelPosition.h>
#include <Export/SaveFormat.h>
#include <system/smart_ptr.h>
#include <system/string.h>

using namespace Aspose::Slides;
using namespace Aspose::Slides::Charts;
using namespace Aspose::Slides::Export;
using namespace System;

auto presentation = MakeObject<Presentation>();
auto slide = presentation->get_Slide(0);

auto chart = slide->get_Shapes()->AddChart(ChartType::Pie, 50, 50, 200, 200);
auto series = chart->get_ChartData()->get_Series();

auto label = series->idx_get(0)->get_Label(0);
label->get_DataLabelFormat()->set_ShowValue(true);
label->get_DataLabelFormat()->set_Position(LegendDataLabelPosition::OutsideEnd);
label->set_X(0.71f);
label->set_Y(0.04f);

presentation->Save(u"presentation.pptx", SaveFormat::Pptx);
FAQ
Bagaimana saya dapat mencegah label data saling tumpang tindih pada diagram yang padat?
Gabungkan penempatan label otomatis, garis pemimpin, dan ukuran font yang lebih kecil; jika perlu, sembunyikan beberapa bidang (misalnya kategori) atau tampilkan label hanya untuk nilai ekstrem atau titik kunci.
Bagaimana saya dapat menonaktifkan label hanya untuk nilai nol, negatif, atau kosong?
Filter titik data sebelum mengaktifkan label dan matikan tampilan untuk nilai 0, nilai negatif, atau nilai yang hilang sesuai aturan yang ditentukan.
Bagaimana saya dapat memastikan gaya label konsisten saat mengekspor ke PDF/gambar?
Tentukan secara eksplisit keluarga font dan ukuran, serta pastikan font tersebut tersedia di lingkungan rendering untuk menghindari fallback.