
Beheer diagramgegevenslabels in presentaties met C++
Inleiding
Gegevenslabels tonen informatie over diagramreeksen en individuele gegevenspunten, waardoor lezers waarden kunnen identificeren en het diagram kunnen begrijpen. Dit artikel legt uit hoe u waarden kunt opmaken, percentages kunt weergeven, labeltekst kunt lezen, labels buiten de as‑maximum kunt beheersen, de afstand tussen aslabels van de categoriasas kunt aanpassen en labels van cirkeldiagrammen kunt positioneren.
Gegevensprecisie instellen in diagramgegevenslabels
Gebruik set_NumberFormatOfValues om serie‑waarden op te maken. Dit voorbeeld maakt een lijndiagram met standaardgegevens, toont de gegevenstabel en schakelt waardelabels in voor de eerste serie. Het formaat #,##0.00 toont een duizendtallen‑scheidingsteken en twee decimalen zonder de onderliggende waarden te wijzigen.
#include <DOM/Presentation.h>
#include <DOM/ISlide.h>
#include <DOM/IShapeCollection.h>
#include <DOM/IChart.h>
#include <DOM/Chart/ChartType.h>
#include <DOM/Chart/IChartData.h>
#include <DOM/Chart/IChartSeriesCollection.h>
#include <DOM/Chart/IChartSeries.h>
#include <DOM/Chart/IDataLabelCollection.h>
#include <DOM/Chart/IDataLabelFormat.h>
#include <Export/SaveFormat.h>
#include <system/smart_ptr.h>
#include <system/string.h>

using namespace Aspose::Slides;
using namespace Aspose::Slides::Charts;
using namespace Aspose::Slides::Export;
using namespace System;

auto presentation = MakeObject<Presentation>();
auto slide = presentation->get_Slide(0);

auto chart = slide->get_Shapes()->AddChart(ChartType::Line, 50, 50, 450, 300);
chart->set_HasDataTable(true);

auto series = chart->get_ChartData()->get_Series()->idx_get(0);
series->set_NumberFormatOfValues(u"#,##0.00");
series->get_Labels()->get_DefaultDataLabelFormat()->set_ShowValue(true);

presentation->Save(u"PrecisionOfDatalabels_out.pptx", SaveFormat::Pptx);
Percentage weergeven als labels
Voor een gestapeld kolomdiagram berekent u elke waarde als een percentage van het totaal van de categorie en kent u de tekst toe aan het tekstframe dat wordt geretourneerd door get_TextFrameForOverriding. Dit voorbeeld gebruikt de standaarddiagramgegevens en toont percentages met twee decimalen in een lettertype van 8 punten. Categorieën met een totaal van nul worden overgeslagen om deling door nul te voorkomen. Rekenkien de aangepaste labeltekst opnieuw uit wanneer de diagramgegevens wijzigen.
#include <DOM/Presentation.h>
#include <DOM/ISlide.h>
#include <DOM/IShapeCollection.h>
#include <DOM/IChart.h>
#include <DOM/Chart/ChartType.h>
#include <DOM/Chart/IChartData.h>
#include <DOM/Chart/IChartCategoryCollection.h>
#include <DOM/Chart/IChartSeriesCollection.h>
#include <DOM/Chart/IChartSeries.h>
#include <DOM/Chart/IChartDataPointCollection.h>
#include <DOM/Chart/IChartDataPoint.h>
#include <DOM/Chart/IDoubleChartValue.h>
#include <DOM/Chart/IDataLabel.h>
#include <DOM/Chart/IDataLabelCollection.h>
#include <DOM/Chart/IDataLabelFormat.h>
#include <DOM/Portion.h>
#include <DOM/IPortionFormat.h>
#include <DOM/ITextFrame.h>
#include <DOM/IParagraph.h>
#include <DOM/IParagraphCollection.h>
#include <DOM/IPortionCollection.h>
#include <system/convert.h>
#include <vector>
#include <Export/SaveFormat.h>
#include <system/smart_ptr.h>
#include <system/string.h>

using namespace Aspose::Slides;
using namespace Aspose::Slides::Charts;
using namespace Aspose::Slides::Export;
using namespace System;

auto presentation = MakeObject<Presentation>();
auto slide = presentation->get_Slide(0);

auto chart = slide->get_Shapes()->AddChart(ChartType::StackedColumn, 20, 20, 400, 400);

auto categoryTotals = std::vector<double>(chart->get_ChartData()->get_Categories()->get_Count(), 0.0);
for (auto k = 0; k < chart->get_ChartData()->get_Categories()->get_Count(); k++)
{
    for (auto i = 0; i < chart->get_ChartData()->get_Series()->get_Count(); i++)
    {
        auto series = chart->get_ChartData()->get_Series()->idx_get(i);
        auto pointValue = Convert::ToDouble(series->get_DataPoint(k)->get_Value()->get_Data());
        categoryTotals[k] += pointValue;
    }
}

for (auto x = 0; x < chart->get_ChartData()->get_Series()->get_Count(); x++)
{
    auto series = chart->get_ChartData()->get_Series()->idx_get(x);
    series->get_Labels()->get_DefaultDataLabelFormat()->set_ShowLegendKey(false);

    for (auto j = 0; j < series->get_DataPoints()->get_Count(); j++)
    {
        auto label = series->get_DataPoint(j)->get_Label();
        if (categoryTotals[j] == 0)
        {
            continue;
        }

        auto pointValue = Convert::ToDouble(series->get_DataPoint(j)->get_Value()->get_Data());
        auto dataPointPercent = (pointValue / categoryTotals[j]) * 100;

        auto portion = MakeObject<Portion>();
        portion->set_Text(String::Format(u"{0:F2} %", dataPointPercent));
        portion->get_PortionFormat()->set_FontHeight(8.0f);

        label->get_TextFrameForOverriding()->set_Text(u"");

        auto paragraph = label->get_TextFrameForOverriding()->get_Paragraphs()->idx_get(0);
        paragraph->get_Portions()->Add(portion);

        label->get_DataLabelFormat()->set_ShowValue(true);
        label->get_DataLabelFormat()->set_ShowSeriesName(false);
        label->get_DataLabelFormat()->set_ShowPercentage(false);
        label->get_DataLabelFormat()->set_ShowLegendKey(false);
        label->get_DataLabelFormat()->set_ShowCategoryName(false);
        label->get_DataLabelFormat()->set_ShowBubbleSize(false);
    }
}

presentation->Save(u"DisplayPercentageAsLabels_out.pptx", SaveFormat::Pptx);
Percentage‑teken instellen met diagramgegevenslabels
Wanneer waarden als breuken zijn opgeslagen, gebruikt u set_NumberFormat om percentages weer te geven. Geef false door aan set_IsNumberFormatLinkedToSource om het label‑formaat onafhankelijk van de broncellen toe te passen.
Dit voorbeeld maakt een 100 % gestapeld kolomdiagram met rode en blauwe reeksen over vier categorieën. Elk waardepaar telt op tot 1. Het label‑formaat 0.0% toont 0.30 als 30.0 %, terwijl de verticale as twee decimalen gebruikt. Beide reeksen gebruiken witte labels met een lettergrootte van 10 punten.
#include <DOM/Presentation.h>
#include <DOM/ISlide.h>
#include <DOM/IShapeCollection.h>
#include <DOM/IChart.h>
#include <DOM/Chart/ChartType.h>
#include <DOM/Chart/IAxesManager.h>
#include <DOM/Chart/IAxis.h>
#include <DOM/Chart/IChartData.h>
#include <DOM/Chart/IChartCategoryCollection.h>
#include <DOM/Chart/IChartDataWorkbook.h>
#include <DOM/Chart/IChartDataCell.h>
#include <DOM/Chart/IChartSeriesCollection.h>
#include <DOM/Chart/IChartSeries.h>
#include <DOM/Chart/IChartDataPointCollection.h>
#include <DOM/Chart/IFormat.h>
#include <DOM/Chart/IDataLabelCollection.h>
#include <DOM/Chart/IDataLabelFormat.h>
#include <DOM/Chart/IChartTextFormat.h>
#include <DOM/Chart/IChartPortionFormat.h>
#include <DOM/FillType.h>
#include <DOM/IFillFormat.h>
#include <DOM/IColorFormat.h>
#include <drawing/color.h>
#include <system/object_ext.h>
#include <Export/SaveFormat.h>
#include <system/smart_ptr.h>
#include <system/string.h>

using namespace Aspose::Slides;
using namespace Aspose::Slides::Charts;
using namespace Aspose::Slides::Export;
using namespace System;
using namespace System::Drawing;

auto presentation = MakeObject<Presentation>();
auto slide = presentation->get_Slide(0);

auto chart = slide->get_Shapes()->AddChart(ChartType::PercentsStackedColumn, 20, 20, 500, 400);

chart->get_Axes()->get_VerticalAxis()->set_IsNumberFormatLinkedToSource(false);
chart->get_Axes()->get_VerticalAxis()->set_NumberFormat(u"0.00%");

chart->get_ChartData()->get_Series()->Clear();
chart->get_ChartData()->get_Categories()->Clear();

auto workbook = chart->get_ChartData()->get_ChartDataWorkbook();
auto worksheetIndex = 0;
for (auto i = 0; i < 4; i++)
{
    auto categoryCell = workbook->GetCell(worksheetIndex, i + 1, 0, ObjectExt::Box(String::Format(u"Category {0}", i + 1)));
    chart->get_ChartData()->get_Categories()->Add(categoryCell);
}

String seriesNames[] = { u"Reds", u"Blues" };
Color seriesColors[] = { Color::get_Red(), Color::get_Blue() };
double values[2][4] = { { 0.30, 0.50, 0.80, 0.65 }, { 0.70, 0.50, 0.20, 0.35 } };

for (auto i = 0; i < 2; i++)
{
    auto seriesCell = workbook->GetCell(worksheetIndex, 0, i + 1, ObjectExt::Box(seriesNames[i]));
    auto series = chart->get_ChartData()->get_Series()->Add(seriesCell, chart->get_Type());
    for (auto j = 0; j < 4; j++)
    {
        auto valueCell = workbook->GetCell(worksheetIndex, j + 1, i + 1, ObjectExt::Box(values[i][j]));
        series->get_DataPoints()->AddDataPointForBarSeries(valueCell);
    }

    series->get_Format()->get_Fill()->set_FillType(FillType::Solid);
    series->get_Format()->get_Fill()->get_SolidFillColor()->set_Color(seriesColors[i]);

    auto labelFormat = series->get_Labels()->get_DefaultDataLabelFormat();
    labelFormat->set_ShowValue(true);
    labelFormat->set_IsNumberFormatLinkedToSource(false);
    labelFormat->set_NumberFormat(u"0.0%");
    labelFormat->get_TextFormat()->get_PortionFormat()->set_FontHeight(10);
    labelFormat->get_TextFormat()->get_PortionFormat()->get_FillFormat()->set_FillType(FillType::Solid);
    labelFormat->get_TextFormat()->get_PortionFormat()->get_FillFormat()->get_SolidFillColor()->set_Color(Color::get_White());
}

presentation->Save(u"SetDataLabelsPercentageSign_out.pptx", SaveFormat::Pptx);
De feitelijke tekst van gegevenslabels lezen
Gebruik GetActualLabelText om de door de instellingen van een gegevenslabel geproduceerde tekst op te halen. Dit is nuttig bij het extraheren van labels voor rapporten, het doorzoeken van presentatiestructuren of het valideren van gegenereerde diagrammen. In het onderstaande voorbeeld combineert het standaard data label format elke categorienaam, serienaam en waarde. Eén punt formatteert zijn waarde als percentage, en een ander gebruikt aangepaste tekst uit get_TextFrameForOverriding.
#include <DOM/Presentation.h>
#include <DOM/ISlide.h>
#include <DOM/IShapeCollection.h>
#include <DOM/IChart.h>
#include <DOM/Chart/ChartType.h>
#include <DOM/Chart/IChartData.h>
#include <DOM/Chart/IChartCategoryCollection.h>
#include <DOM/Chart/IChartDataWorkbook.h>
#include <DOM/Chart/IChartDataCell.h>
#include <DOM/Chart/IChartSeriesCollection.h>
#include <DOM/Chart/IChartSeries.h>
#include <DOM/Chart/IChartDataPointCollection.h>
#include <DOM/Chart/IChartDataPoint.h>
#include <DOM/Chart/IDoubleChartValue.h>
#include <DOM/Chart/IDataLabel.h>
#include <DOM/Chart/IDataLabelCollection.h>
#include <DOM/Chart/IDataLabelFormat.h>
#include <DOM/ITextFrame.h>
#include <system/console.h>
#include <system/object_ext.h>
#include <system/smart_ptr.h>
#include <system/string.h>

using namespace Aspose::Slides;
using namespace Aspose::Slides::Charts;
using namespace System;

auto presentation = MakeObject<Presentation>();
auto slide = presentation->get_Slide(0);

auto chart = slide->get_Shapes()->AddChart(ChartType::ClusteredColumn, 20, 20, 500, 300);

chart->get_ChartData()->get_Series()->Clear();
chart->get_ChartData()->get_Categories()->Clear();

auto workbook = chart->get_ChartData()->get_ChartDataWorkbook();
auto firstCategoryCell = workbook->GetCell(0, 1, 0, ObjectExt::Box<String>(u"Q1"));
chart->get_ChartData()->get_Categories()->Add(firstCategoryCell);
auto secondCategoryCell = workbook->GetCell(0, 2, 0, ObjectExt::Box<String>(u"Q2"));
chart->get_ChartData()->get_Categories()->Add(secondCategoryCell);

auto northSeriesCell = workbook->GetCell(0, 0, 1, ObjectExt::Box<String>(u"North"));
auto north = chart->get_ChartData()->get_Series()->Add(northSeriesCell, chart->get_Type());
auto northFirstValueCell = workbook->GetCell(0, 1, 1, ObjectExt::Box(0.25));
north->get_DataPoints()->AddDataPointForBarSeries(northFirstValueCell);
auto northSecondValueCell = workbook->GetCell(0, 2, 1, ObjectExt::Box(0.75));
north->get_DataPoints()->AddDataPointForBarSeries(northSecondValueCell);

auto southSeriesCell = workbook->GetCell(0, 0, 2, ObjectExt::Box<String>(u"South"));
auto south = chart->get_ChartData()->get_Series()->Add(southSeriesCell, chart->get_Type());
auto southFirstValueCell = workbook->GetCell(0, 1, 2, ObjectExt::Box(0.40));
south->get_DataPoints()->AddDataPointForBarSeries(southFirstValueCell);
auto southSecondValueCell = workbook->GetCell(0, 2, 2, ObjectExt::Box(0.60));
south->get_DataPoints()->AddDataPointForBarSeries(southSecondValueCell);

for (auto i = 0; i < chart->get_ChartData()->get_Series()->get_Count(); i++)
{
    auto series = chart->get_ChartData()->get_Series()->idx_get(i);
    auto format = series->get_Labels()->get_DefaultDataLabelFormat();
    format->set_ShowCategoryName(true);
    format->set_ShowSeriesName(true);
    format->set_ShowValue(true);
}

north->get_Label(1)->get_DataLabelFormat()->set_IsNumberFormatLinkedToSource(false);
north->get_Label(1)->get_DataLabelFormat()->set_NumberFormat(u"0%");
south->get_Label(0)->get_TextFrameForOverriding()->set_Text(u"Reviewed");

for (auto i = 0; i < chart->get_ChartData()->get_Series()->get_Count(); i++)
{
    auto series = chart->get_ChartData()->get_Series()->idx_get(i);
    for (auto j = 0; j < series->get_DataPoints()->get_Count(); j++)
    {
        auto point = series->get_DataPoint(j);
        auto label = point->get_Label();
        if (!label->get_IsVisible())
        {
            continue;
        }

        Console::WriteLine(String::Format(u"Value: {0}; label: {1}", point->get_Value()->get_Data(), label->GetActualLabelText()));
    }
}
Het in een gegevenspunt opgeslagen getal blijft 0.75, zelfs wanneer het label 75% toont samen met de categorie‑ en serienamen. Aangepaste tekst vervangt de gegenereerde labeltekst. GetActualLabelText retourneert in beide gevallen de resulterende label‑tekenreeks. Controleer get_IsVisible apart, zoals hierboven getoond, wanneer u alleen zichtbare labels wilt extraheren.
Gegevenslabels buiten de as‑maximum beheersen
Wanneer u handmatig een asbereik beperkt, kunnen sommige gegevenspunten de maximumwaarde overschrijden. Gebruik set_ShowDataLabelsOverMaximum om te bepalen of hun gegevenslabels worden weergegeven. Deze instelling wijzigt de zichtbaarheid van het label; het wijzigt niet het asbereik of de onderliggende gegevenswaarden.
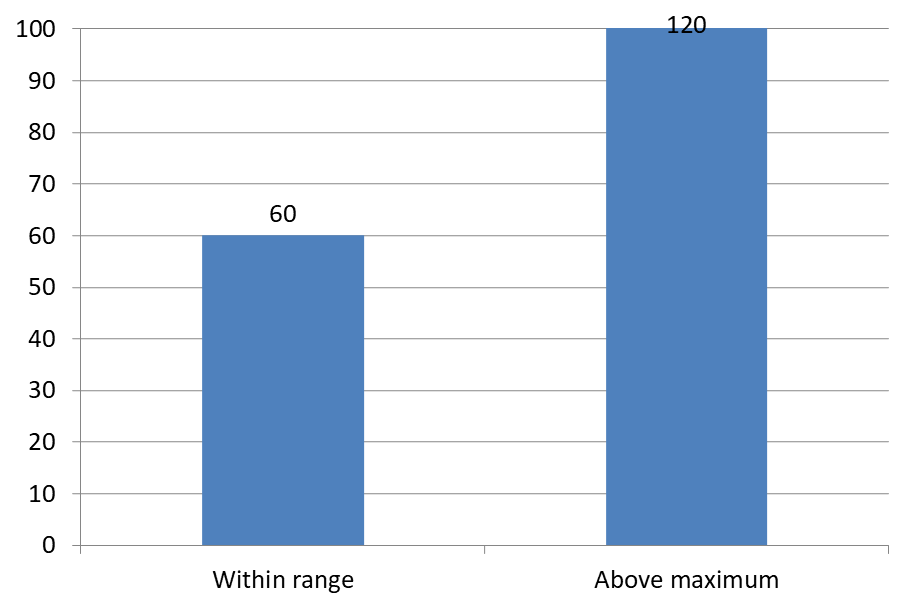
Het onderstaande voorbeeld maakt een 2D gegroepeerd kolomdiagram met waarden van 60 en 120. Het stelt set_IsAutomaticMaxValue in op false en set_MaxValue op 100 voor de verticale as. De eerste dia staat labels toe buiten de maximumwaarde; een kopie van die dia schakelt ze uit. Beide dia’s worden opgeslagen in DataLabelsOverMaximum.pptx.
Schakel waardelabels in met set_ShowValue. De instelling op diagramniveau activeert niet automatisch de weergave van waarden en overschrijft ook niet de uitschakeling van waardweergave voor een individueel label. Dit voorbeeld schakelt waarden in voor de hele serie en gebruikt set_Position om labels aan het buitenste einde van elke kolom te plaatsen.
#include <DOM/Presentation.h>
#include <DOM/ISlide.h>
#include <DOM/ISlideCollection.h>
#include <DOM/IShapeCollection.h>
#include <DOM/IChart.h>
#include <DOM/Chart/ChartType.h>
#include <DOM/Chart/IAxesManager.h>
#include <DOM/Chart/IAxis.h>
#include <DOM/Chart/IChartData.h>
#include <DOM/Chart/IChartCategoryCollection.h>
#include <DOM/Chart/IChartDataWorkbook.h>
#include <DOM/Chart/IChartDataCell.h>
#include <DOM/Chart/IChartSeriesCollection.h>
#include <DOM/Chart/IChartSeries.h>
#include <DOM/Chart/IChartDataPointCollection.h>
#include <DOM/Chart/IDataLabelCollection.h>
#include <DOM/Chart/IDataLabelFormat.h>
#include <DOM/Chart/LegendDataLabelPosition.h>
#include <Export/SaveFormat.h>
#include <system/object_ext.h>
#include <system/smart_ptr.h>
#include <system/string.h>

using namespace Aspose::Slides;
using namespace Aspose::Slides::Charts;
using namespace Aspose::Slides::Export;
using namespace System;

auto presentation = MakeObject<Presentation>();
auto slide = presentation->get_Slide(0);

auto chart = slide->get_Shapes()->AddChart(ChartType::ClusteredColumn, 50, 50, 600, 400);
chart->set_HasLegend(false);

chart->get_ChartData()->get_Series()->Clear();
chart->get_ChartData()->get_Categories()->Clear();

auto workbook = chart->get_ChartData()->get_ChartDataWorkbook();

auto firstCategory = workbook->GetCell(0, 1, 0, ObjectExt::Box<String>(u"Within range"));
auto secondCategory = workbook->GetCell(0, 2, 0, ObjectExt::Box<String>(u"Above maximum"));

chart->get_ChartData()->get_Categories()->Add(firstCategory);
chart->get_ChartData()->get_Categories()->Add(secondCategory);

auto seriesName = workbook->GetCell(0, 0, 1, ObjectExt::Box<String>(u"Values"));
auto series = chart->get_ChartData()->get_Series()->Add(seriesName, chart->get_Type());

auto firstValue = workbook->GetCell(0, 1, 1, ObjectExt::Box(60));
auto secondValue = workbook->GetCell(0, 2, 1, ObjectExt::Box(120));

series->get_DataPoints()->AddDataPointForBarSeries(firstValue);
series->get_DataPoints()->AddDataPointForBarSeries(secondValue);

series->get_Labels()->get_DefaultDataLabelFormat()->set_ShowValue(true);
series->get_Labels()->get_DefaultDataLabelFormat()->set_Position(LegendDataLabelPosition::OutsideEnd);

chart->get_Axes()->get_VerticalAxis()->set_IsAutomaticMaxValue(false);
chart->get_Axes()->get_VerticalAxis()->set_MaxValue(100);
chart->set_ShowDataLabelsOverMaximum(true);

auto secondSlide = presentation->get_Slides()->AddClone(slide);
auto secondChart = ExplicitCast<IChart>(secondSlide->get_Shape(0));
secondChart->set_ShowDataLabelsOverMaximum(false);

presentation->Save(u"DataLabelsOverMaximum.pptx", SaveFormat::Pptx);
De volgende afbeeldingen tonen de opgeslagen dia’s die zijn gerenderd door Microsoft PowerPoint. Met true is het label 120 zichtbaar aan de bovenkant; met false is het verborgen. Het label 60 blijft zichtbaar, het as‑maximum blijft op 100, en het tweede gegevenspunt blijft 120 in beide gevallen.
| ShowDataLabelsOverMaximum = true | ShowDataLabelsOverMaximum = false |
|---|---|
 |
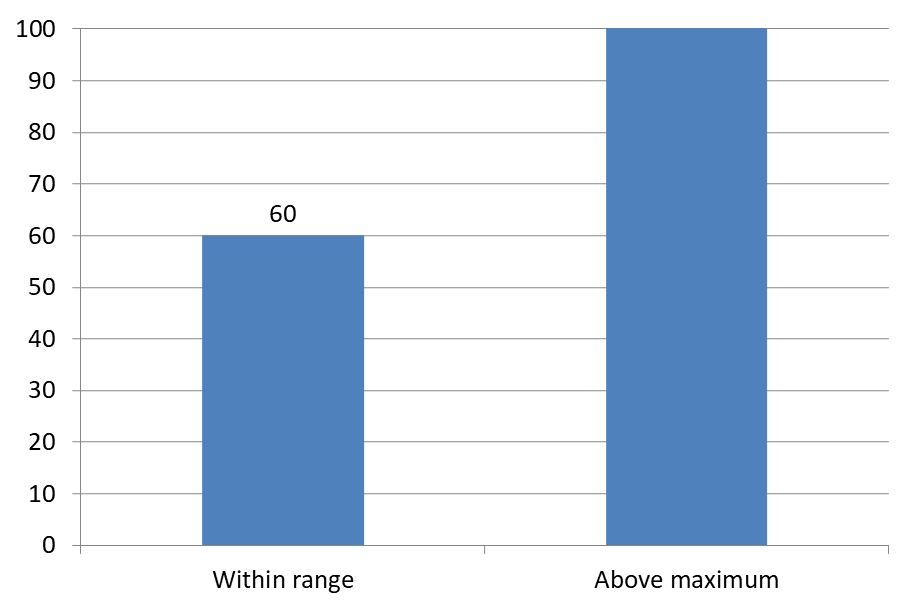 |
Chart Type
Dit voorbeeld gebruikt een 2D kolomdiagram met een waardenas. Diagrammen zonder waardenas, zoals cirkel‑ en donutdiagrammen, hebben geen as‑maximum dat op deze manier kan worden beperkt.Afstand van label tot as instellen
Gebruik set_LabelOffset om de afstand tussen de aslabels van de categoriasas en de as te regelen. De waarde is een percentage van de maximale lettergrootte van de aslabels. Dit voorbeeld maakt een gegroepeerd kolomdiagram en stelt de horizontale as‑label‑offset in op 500. Deze instelling beïnvloedt de categoriasas‑labels in plaats van de labels die aan individuele gegevenspunten zijn gekoppeld.
#include <DOM/Presentation.h>
#include <DOM/ISlide.h>
#include <DOM/IShapeCollection.h>
#include <DOM/IChart.h>
#include <DOM/Chart/ChartType.h>
#include <DOM/Chart/IAxesManager.h>
#include <DOM/Chart/IAxis.h>
#include <Export/SaveFormat.h>
#include <system/smart_ptr.h>
#include <system/string.h>

using namespace Aspose::Slides;
using namespace Aspose::Slides::Charts;
using namespace Aspose::Slides::Export;
using namespace System;

auto presentation = MakeObject<Presentation>();
auto slide = presentation->get_Slide(0);

auto chart = slide->get_Shapes()->AddChart(ChartType::ClusteredColumn, 20, 20, 500, 300);
chart->get_Axes()->get_HorizontalAxis()->set_LabelOffset(500);

presentation->Save(u"SetCategoryAxisLabelDistance_out.pptx", SaveFormat::Pptx);
Labelpositie aanpassen
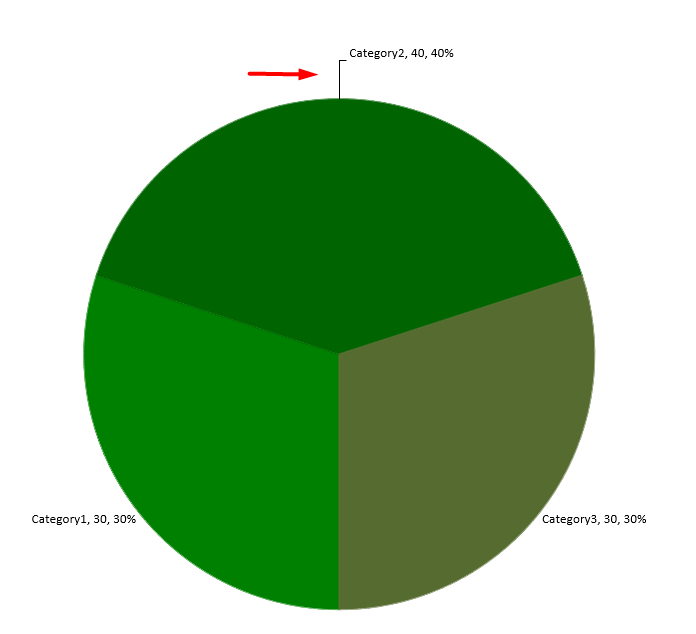
Pas op een cirkeldiagram de posities van gegevenslabels aan om de afstand te verbeteren en ruimte te maken voor voortzettingslijnen.
Dit voorbeeld toont de waarde van het eerste gegevenspunt, plaatst het label buiten de sector, en gebruikt set_X en set_Y om de verschuivingen aan te passen. Deze verschuivingen zijn respectievelijk relatief ten opzichte van de diagram‑breedte en -hoogte.
#include <DOM/Presentation.h>
#include <DOM/ISlide.h>
#include <DOM/IShapeCollection.h>
#include <DOM/IChart.h>
#include <DOM/Chart/ChartType.h>
#include <DOM/Chart/IChartData.h>
#include <DOM/Chart/IChartSeriesCollection.h>
#include <DOM/Chart/IChartSeries.h>
#include <DOM/Chart/IDataLabel.h>
#include <DOM/Chart/IDataLabelFormat.h>
#include <DOM/Chart/LegendDataLabelPosition.h>
#include <Export/SaveFormat.h>
#include <system/smart_ptr.h>
#include <system/string.h>

using namespace Aspose::Slides;
using namespace Aspose::Slides::Charts;
using namespace Aspose::Slides::Export;
using namespace System;

auto presentation = MakeObject<Presentation>();
auto slide = presentation->get_Slide(0);

auto chart = slide->get_Shapes()->AddChart(ChartType::Pie, 50, 50, 200, 200);
auto series = chart->get_ChartData()->get_Series();

auto label = series->idx_get(0)->get_Label(0);
label->get_DataLabelFormat()->set_ShowValue(true);
label->get_DataLabelFormat()->set_Position(LegendDataLabelPosition::OutsideEnd);
label->set_X(0.71f);
label->set_Y(0.04f);

presentation->Save(u"presentation.pptx", SaveFormat::Pptx);
Meerdere rijen gegevenslabels boven een kolomdiagram toevoegen
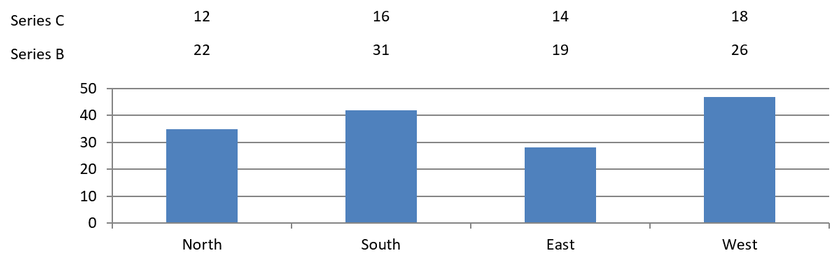
Dit voorbeeld maakt een kolomdiagram met twee rijen gegevenslabels boven het plotgebied. Serie A toont de zichtbare kolommen, terwijl Serie B en Serie C de extra labels leveren. Hun kolommen worden verborgen door de vulling en contour te verwijderen. De methode set_Overlap lijn drie reeksen uit op dezelfde categoriemiddens.
De instellingen van get_PlotArea reserveren ruimte voor de labelrijen. Na berekening van de standaardposities door ValidateChartLayout behouden set_X en set_Y de horizontale uitlijning en passen verticale verschuivingen toe om de labels in twee rijen te rangschikken. De cijfers blijven gegevenslabels gekoppeld aan de seriewaarden; alleen de rij‑koppen zijn afzonderlijke tekstvormen.
#include <DOM/Presentation.h>
#include <DOM/ISlide.h>
#include <DOM/IShapeCollection.h>
#include <DOM/IChart.h>
#include <DOM/Chart/ChartType.h>
#include <DOM/Chart/IChartData.h>
#include <DOM/Chart/IChartCategoryCollection.h>
#include <DOM/Chart/IChartDataWorkbook.h>
#include <DOM/Chart/IChartDataCell.h>
#include <DOM/Chart/IChartSeriesCollection.h>
#include <DOM/Chart/IChartSeries.h>
#include <DOM/Chart/IChartDataPointCollection.h>
#include <DOM/Chart/IChartDataPoint.h>
#include <DOM/Chart/IChartSeriesGroup.h>
#include <DOM/Chart/IFormat.h>
#include <DOM/Chart/IDataLabelCollection.h>
#include <DOM/Chart/IDataLabelFormat.h>
#include <DOM/Chart/IDataLabel.h>
#include <DOM/Chart/IChartTextFormat.h>
#include <DOM/Chart/IChartPortionFormat.h>
#include <DOM/Chart/LegendDataLabelPosition.h>
#include <DOM/Chart/IAxesManager.h>
#include <DOM/Chart/IAxis.h>
#include <DOM/Chart/IChartPlotArea.h>
#include <DOM/Chart/LayoutTargetType.h>
#include <DOM/FillType.h>
#include <DOM/IFillFormat.h>
#include <DOM/ILineFormat.h>
#include <DOM/IColorFormat.h>
#include <DOM/ShapeType.h>
#include <DOM/IAutoShape.h>
#include <DOM/ITextFrame.h>
#include <DOM/ITextFrameFormat.h>
#include <DOM/IParagraphCollection.h>
#include <DOM/IParagraph.h>
#include <DOM/IPortionCollection.h>
#include <DOM/IPortion.h>
#include <DOM/IPortionFormat.h>
#include <Export/SaveFormat.h>
#include <drawing/color.h>
#include <system/object_ext.h>
#include <system/smart_ptr.h>
#include <system/string.h>

using namespace Aspose::Slides;
using namespace Aspose::Slides::Charts;
using namespace Aspose::Slides::Export;
using namespace System;
using namespace System::Drawing;

auto presentation = MakeObject<Presentation>();
auto slide = presentation->get_Slide(0);

auto chart = slide->get_Shapes()->AddChart(ChartType::ClusteredColumn, 40, 40, 640, 200);
chart->set_HasTitle(false);
chart->set_HasLegend(false);
chart->get_TextFormat()->get_PortionFormat()->set_FontHeight(12);

chart->get_ChartData()->get_Series()->Clear();
chart->get_ChartData()->get_Categories()->Clear();

auto workbook = chart->get_ChartData()->get_ChartDataWorkbook();
workbook->Clear(0);

String categories[] = { u"North", u"South", u"East", u"West" };
String seriesNames[] = { u"Series A", u"Series B", u"Series C" };
double seriesValues[3][4] = {
    { 35, 42, 28, 47 },
    { 22, 31, 19, 26 },
    { 12, 16, 14, 18 }
};

for (auto categoryIndex = 0; categoryIndex < 4; categoryIndex++)
{
    auto categoryCell = workbook->GetCell(0, categoryIndex + 1, 0, ObjectExt::Box(categories[categoryIndex]));
    chart->get_ChartData()->get_Categories()->Add(categoryCell);
}

for (auto seriesIndex = 0; seriesIndex < 3; seriesIndex++)
{
    auto seriesCell = workbook->GetCell(0, 0, seriesIndex + 1, ObjectExt::Box(seriesNames[seriesIndex]));
    auto series = chart->get_ChartData()->get_Series()->Add(seriesCell, ChartType::ClusteredColumn);

    for (auto categoryIndex = 0; categoryIndex < 4; categoryIndex++)
    {
        auto valueCell = workbook->GetCell(0, categoryIndex + 1, seriesIndex + 1, ObjectExt::Box(seriesValues[seriesIndex][categoryIndex]));
        series->get_DataPoints()->AddDataPointForBarSeries(valueCell);
    }

    if (seriesIndex > 0)
    {
        // Verberg de kolommen van B en C, maar behoud hun gegevenslabels.
        series->get_Format()->get_Fill()->set_FillType(FillType::NoFill);
        series->get_Format()->get_Line()->get_FillFormat()->set_FillType(FillType::NoFill);
        auto labelFormat = series->get_Labels()->get_DefaultDataLabelFormat();
        labelFormat->set_ShowValue(true);
        labelFormat->get_TextFormat()->get_PortionFormat()->set_FontHeight(12);
        auto labelFill = labelFormat->get_TextFormat()->get_PortionFormat()->get_FillFormat();
        labelFill->set_FillType(FillType::Solid);
        labelFill->get_SolidFillColor()->set_Color(Color::get_Black());
        labelFormat->set_Position(LegendDataLabelPosition::InsideBase);
    }
}

// Lijn alle drie de reeksen uit op dezelfde categoriemiddens.
chart->get_ChartData()->get_Series()->idx_get(0)->get_ParentSeriesGroup()->set_Overlap(100);

// Gebruik minder rasterlijnen voor dit compacte voorbeeld.
chart->get_Axes()->get_VerticalAxis()->set_IsAutomaticMajorUnit(false);
chart->get_Axes()->get_VerticalAxis()->set_MajorUnit(10);

// Reserveer ruimte boven de plot voor twee rijen gegevenslabels.
chart->get_PlotArea()->set_LayoutTargetType(LayoutTargetType::Inner);
chart->get_PlotArea()->set_X(0.15f);
chart->get_PlotArea()->set_Y(0.32f);
chart->get_PlotArea()->set_Width(0.80f);
chart->get_PlotArea()->set_Height(0.48f);
chart->ValidateChartLayout();

for (auto seriesIndex = 1; seriesIndex < 3; seriesIndex++)
{
    auto series = chart->get_ChartData()->get_Series()->idx_get(seriesIndex);
    auto rowTop = seriesIndex == 1 ? 0.15f : 0.03f;

    for (auto categoryIndex = 0; categoryIndex < 4; categoryIndex++)
    {
        auto dataLabel = series->get_DataPoint(categoryIndex)->get_Label();
        // Behoud de standaard horizontale positie. Y is een verschuiving ten opzichte van
        // de standaard labelpositie, uitgedrukt als een fractie van de diagramhoogte.
        dataLabel->set_X(0);
        dataLabel->set_Y(rowTop - dataLabel->get_ActualY() / chart->get_Height());
    }

    // Alleen de rij‑kop is een afzonderlijke tekstvorm.
    auto rowHeading = slide->get_Shapes()->AddAutoShape(ShapeType::Rectangle, chart->get_X(), chart->get_Y() + rowTop * chart->get_Height(), 85, 18);
    rowHeading->get_FillFormat()->set_FillType(FillType::NoFill);
    rowHeading->get_LineFormat()->get_FillFormat()->set_FillType(FillType::NoFill);
    rowHeading->AddTextFrame(seriesNames[seriesIndex]);
    rowHeading->get_TextFrame()->get_TextFrameFormat()->set_MarginTop(0);
    rowHeading->get_TextFrame()->get_TextFrameFormat()->set_MarginBottom(0);
    auto headingFormat = rowHeading->get_TextFrame()->get_Paragraphs()->idx_get(0)->get_Portions()->idx_get(0)->get_PortionFormat();
    headingFormat->set_FontHeight(12);
    headingFormat->get_FillFormat()->set_FillType(FillType::Solid);
    headingFormat->get_FillFormat()->get_SolidFillColor()->set_Color(Color::get_Black());
}

presentation->Save(u"multiple-rows-of-labels.pptx", SaveFormat::Pptx);
Veelgestelde vragen
Hoe kan ik voorkomen dat gegevenslabels overlappen in dichte diagrammen?
Combineer automatische label‑plaatsing, voortzettingslijnen en een kleinere lettergrootte; indien nodig verberg enkele velden (bijvoorbeeld de categorie) of toon labels alleen voor extreme waarden of belangrijke punten.
Hoe kan ik labels alleen uitschakelen voor nul-, negatieve of lege waarden?
Filter de gegevenspunten voordat u labels inschakelt en schakel de weergave uit voor waarden van 0, negatieve waarden of ontbrekende waarden volgens een gedefinieerde regel.
Hoe kan ik een consistente labelstijl garanderen bij export naar PDF/afbeeldingen?
Stel expliciet de lettertypefamilie en grootte in en controleer of het lettertype beschikbaar is in de renderomgeving om een fallback te voorkomen.