
สร้างหรืออัปเดตแผนภูมิการนำเสนอ PowerPoint ใน .NET
ภาพรวม
บทความนี้ให้คำแนะนำอย่างครบถ้วนเกี่ยวกับวิธีสร้างและปรับแต่งแผนภูมิด้วย Aspose.Slides สำหรับ .NET คุณจะได้เรียนรู้วิธีเพิ่มแผนภูมิลงในสไลด์โดยโปรแกรม การใส่ข้อมูลลงในแผนภูมิ และการใช้ตัวเลือกการจัดรูปแบบต่าง ๆ เพื่อให้ตรงกับความต้องการการออกแบบของคุณ ตลอดบทความจะมีตัวอย่างโค้ดโดยละเอียดแสดงแต่ละขั้นตอน ตั้งแต่การเริ่มต้นพรีเซนเทชันและอ็อบเจกต์แผนภูมิจนถึงการกำหนดซีรีส์, แกนและคำอธิบายโดยสรุป โดยการทำตามแนวทางนี้คุณจะเข้าใจการรวมการสร้างแผนภูมิเกิงพลวัตเข้ากับแอปพลิเคชัน .NET ของคุณอย่างมั่นคงและทำให้กระบวนการสร้างพรีเซนเทชันที่ขับเคลื่อนด้วยข้อมูลเป็นเรื่องง่าย
สร้างแผนภูมิ
แผนภูมิช่วยให้ผู้ใช้มองเห็นข้อมูลได้อย่างรวดเร็วและได้ข้อสรุปที่อาจไม่ชัดเจนจากตารางหรือสเปรดชีต
ทำไมต้องสร้างแผนภูมิ?
ใช้แผนภูมิคุณสามารถ:
- รวม, ย่อ, หรือสรุปข้อมูลจำนวนมากในสไลด์เดียวของการนำเสนอ;
- เปิดเผยรูปแบบและแนวโน้มของข้อมูล;
- สรุปทิศทางและแรงขับเคลื่อนของข้อมูลตามเวลา หรือกับหน่วยวัดเฉพาะ;
- ระบุค่าผิดปกติ, ความเบี่ยงเบน, ข้อผิดพลาด, และข้อมูลที่ไม่มีความหมาย;
- สื่อสารหรือแสดงข้อมูลที่ซับซ้อน
ใน PowerPoint คุณสามารถสร้างแผนภูมิผ่านฟังก์ชัน Insert ที่ให้เทมเพลตสำหรับออกแบบแผนภูมิต่าง ๆ ด้วย Aspose.Slides คุณสามารถสร้างแผนภูมิแบบปกติ (อิงจากประเภทแผนภูมิยอดนิยม) และแผนภูมิที่กำหนดเอง
สร้างแผนภูมิคอลัมน์แบบกลุ่ม
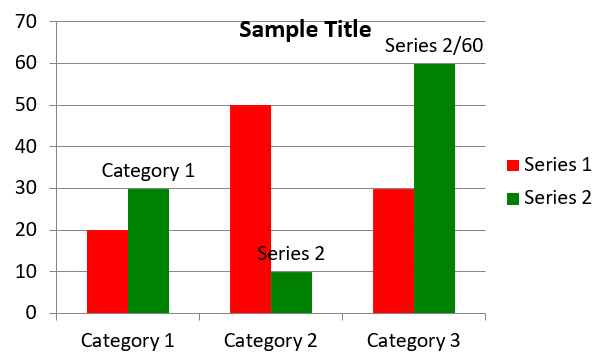
ส่วนนี้อธิบายวิธีสร้างแผนภูมิคอลัมน์แบบกลุ่มด้วย Aspose.Slides สำหรับ .NET คุณจะได้เรียนรู้การเริ่มต้นพรีเซนเทชัน, เพิ่มแผนภูมิ, และปรับแต่งส่วนประกอบต่าง ๆ เช่น ชื่อ, ข้อมูล, ซีรีส์, ประเภท, และสไตล์ โดยทำตามขั้นตอนต่อไปนี้เพื่อดูว่าแผนภูมิคอลัมน์แบบกลุ่มมาตรฐานถูกสร้างอย่างไร:
- สร้างอินสแตนซ์ของคลาส Presentation
- รับอ้างอิงถึงสไลด์โดยใช้ตำแหน่งดัชนีของมัน
- เพิ่มแผนภูมิพร้อมข้อมูลบางส่วนและระบุประเภท
ChartType.ClusteredColumn - เพิ่มชื่อให้กับแผนภูมิ
- เข้าถึงเวิร์กชีตข้อมูลของแผนภูมิ
- ลบซีรีส์และประเภทเริ่มต้นทั้งหมด
- เพิ่มซีรีส์และประเภทใหม่
- เพิ่มข้อมูลแผนภูมิใหม่สำหรับซีรีส์แผนภูมิ
- ใช้สีเติมในซีรีส์แผนภูมิ
- เพิ่มป้ายกำกับให้กับซีรีส์แผนภูมิ
- บันทึกพรีเซนเทชันที่แก้ไขเป็นไฟล์ PPTX
using System.Drawing;
using Aspose.Slides;
using Aspose.Slides.Charts;
using Aspose.Slides.Export;

// สร้างอินสแตนซ์ของคลาส Presentation.
using (Presentation presentation = new Presentation())
{
    // เข้าถึงสไลด์แรก.
    ISlide slide = presentation.Slides[0];

    // เพิ่มแผนภูมิคอลัมน์แบบกลุ่มพร้อมข้อมูลเริ่มต้น.
    IChart chart = slide.Shapes.AddChart(ChartType.ClusteredColumn, 20, 20, 500, 300);

    // ตั้งค่าชื่อแผนภูมิ.
    chart.ChartTitle.AddTextFrameForOverriding("Sample Title");
    chart.ChartTitle.TextFrameForOverriding.TextFrameFormat.CenterText = NullableBool.True;
    chart.ChartTitle.Height = 20;
    chart.HasTitle = true;

    // ตั้งค่าดัชนีของแผ่นข้อมูลแผนภูมิ.
    int worksheetIndex = 0;

    // ดึงเวิร์กบุ๊กข้อมูลแผนภูมิ.
    IChartDataWorkbook workbook = chart.ChartData.ChartDataWorkbook;

    // ลบซีรีส์และประเภทที่สร้างโดยอัตโนมัติเริ่มต้น.
    chart.ChartData.Series.Clear();
    chart.ChartData.Categories.Clear();

    // เพิ่มซีรีส์ใหม่.
    chart.ChartData.Series.Add(workbook.GetCell(worksheetIndex, 0, 1, "Series 1"), chart.Type);
    chart.ChartData.Series.Add(workbook.GetCell(worksheetIndex, 0, 2, "Series 2"), chart.Type);

    // เพิ่มประเภทใหม่.
    chart.ChartData.Categories.Add(workbook.GetCell(worksheetIndex, 1, 0, "Category 1"));
    chart.ChartData.Categories.Add(workbook.GetCell(worksheetIndex, 2, 0, "Category 2"));
    chart.ChartData.Categories.Add(workbook.GetCell(worksheetIndex, 3, 0, "Category 3"));

    // ดึงซีรีส์แผนภูม้อันดับแรก.
    IChartSeries series = chart.ChartData.Series[0];

    // เติมข้อมูลให้กับซีรีส์.
    series.DataPoints.AddDataPointForBarSeries(workbook.GetCell(worksheetIndex, 1, 1, 20));
    series.DataPoints.AddDataPointForBarSeries(workbook.GetCell(worksheetIndex, 2, 1, 50));
    series.DataPoints.AddDataPointForBarSeries(workbook.GetCell(worksheetIndex, 3, 1, 30));

    // ตั้งค่าสีเติมให้กับซีรีส์.
    series.Format.Fill.FillType = FillType.Solid;
    series.Format.Fill.SolidFillColor.Color = Color.Red;

    // ดึงซีรีส์แผนภูมิที่สอง.
    series = chart.ChartData.Series[1];

    // เติมข้อมูลให้กับซีรีส์.
    series.DataPoints.AddDataPointForBarSeries(workbook.GetCell(worksheetIndex, 1, 2, 30));
    series.DataPoints.AddDataPointForBarSeries(workbook.GetCell(worksheetIndex, 2, 2, 10));
    series.DataPoints.AddDataPointForBarSeries(workbook.GetCell(worksheetIndex, 3, 2, 60));

    // ตั้งค่าสีเติมให้กับซีรีส์.
    series.Format.Fill.FillType = FillType.Solid;
    series.Format.Fill.SolidFillColor.Color = Color.Green;

    // ตั้งค่าป้ายกำกับแรกให้แสดงชื่อประเภท.
    IDataLabel label = series.DataPoints[0].Label;
    label.DataLabelFormat.ShowCategoryName = true;

    label = series.DataPoints[1].Label;
    label.DataLabelFormat.ShowSeriesName = true;

    // ตั้งค่าซีรีส์ให้แสดงค่าสำหรับป้ายกำกับที่สาม.
    label = series.DataPoints[2].Label;
    label.DataLabelFormat.ShowValue = true;
    label.DataLabelFormat.ShowSeriesName = true;
    label.DataLabelFormat.Separator = "/";

    // บันทึกพรีเซนเทชันลงดิสก์เป็นไฟล์ PPTX.
    presentation.Save("AsposeChart_out.pptx", SaveFormat.Pptx);
}
ผลลัพธ์:
สร้างแผนภูมิกระจาย
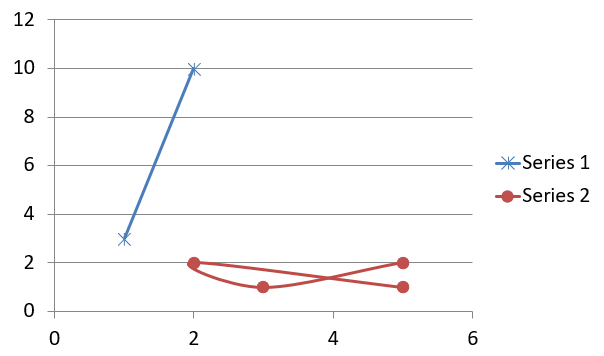
แผนภูมิกระจาย (หรือที่เรียกว่ากราฟกระจายจุด) มักใช้เพื่อตรวจสอบรูปแบบหรือแสดงความสัมพันธ์ระหว่างสองตัวแปร
ใช้แผนภูมิกระจายในกรณีที่:
- คุณมีข้อมูลตัวเลขเป็นคู่
- คุณมีสองตัวแปรที่เชื่อมโยงกันอย่างดี
- คุณต้องการตรวจสอบว่าตัวแปรสองตัวมีความสัมพันธ์หรือไม่
- คุณมีตัวแปรอิสระที่มีค่าหลายค่าเพื่อใช้กับตัวแปรตาม
using Aspose.Slides;
using Aspose.Slides.Charts;
using Aspose.Slides.Export;

// สร้างอินสแตนซ์ของคลาส Presentation.
using (Presentation presentation = new Presentation())
{
    // เข้าถึงสไลด์แรก.
    ISlide slide = presentation.Slides[0];

    // สร้างแผนภูมิกระจายเริ่มต้น.
    IChart chart = slide.Shapes.AddChart(ChartType.ScatterWithSmoothLines, 20, 20, 500, 300);

    // ตั้งค่าดัชนีของแผ่นข้อมูลแผนภูมิ.
    int worksheetIndex = 0;

    // ดึงเวิร์กบุ๊กข้อมูลแผนภูมิ.
    IChartDataWorkbook workbook = chart.ChartData.ChartDataWorkbook;

    // ลบซีรีส์เริ่มต้น.
    chart.ChartData.Series.Clear();

    // เพิ่มซีรีส์ใหม่.
    chart.ChartData.Series.Add(workbook.GetCell(worksheetIndex, 1, 1, "Series 1"), chart.Type);
    chart.ChartData.Series.Add(workbook.GetCell(worksheetIndex, 1, 3, "Series 2"), chart.Type);

    // ดึงซีรีส์แผนภูม้อันดับแรก.
    IChartSeries series = chart.ChartData.Series[0];

    // เพิ่มจุดใหม่ (1:3) ให้กับซีรีส์.
    series.DataPoints.AddDataPointForScatterSeries(workbook.GetCell(worksheetIndex, 2, 1, 1), workbook.GetCell(worksheetIndex, 2, 2, 3));

    // เพิ่มจุดใหม่ (2:10).
    series.DataPoints.AddDataPointForScatterSeries(workbook.GetCell(worksheetIndex, 3, 1, 2), workbook.GetCell(worksheetIndex, 3, 2, 10));

    // เปลี่ยนประเภทของซีรีส์.
    series.Type = ChartType.ScatterWithStraightLinesAndMarkers;

    // เปลี่ยนเครื่องหมายของซีรีส์แผนภูมิ.
    series.Marker.Size = 10;
    series.Marker.Symbol = MarkerStyleType.Star;

    // ดึงซีรีส์แผนภูมิที่สอง.
    series = chart.ChartData.Series[1];

    // เพิ่มจุดใหม่ (5:2) ให้กับซีรีส์แผนภูมิ.
    series.DataPoints.AddDataPointForScatterSeries(workbook.GetCell(worksheetIndex, 2, 3, 5), workbook.GetCell(worksheetIndex, 2, 4, 2));

    // เพิ่มจุดใหม่ (3:1).
    series.DataPoints.AddDataPointForScatterSeries(workbook.GetCell(worksheetIndex, 3, 3, 3), workbook.GetCell(worksheetIndex, 3, 4, 1));

    // เพิ่มจุดใหม่ (2:2).
    series.DataPoints.AddDataPointForScatterSeries(workbook.GetCell(worksheetIndex, 4, 3, 2), workbook.GetCell(worksheetIndex, 4, 4, 2));

    // เพิ่มจุดใหม่ (5:1).
    series.DataPoints.AddDataPointForScatterSeries(workbook.GetCell(worksheetIndex, 5, 3, 5), workbook.GetCell(worksheetIndex, 5, 4, 1));

    // เปลี่ยนเครื่องหมายของซีรีส์แผนภูมิ.
    series.Marker.Size = 10;
    series.Marker.Symbol = MarkerStyleType.Circle;

    // บันทึกพรีเซนเทชันลงดิสก์เป็นไฟล์ PPTX.
    presentation.Save("AsposeChart_out.pptx", SaveFormat.Pptx);
}
ผลลัพธ์:
สร้างแผนภูมิวงกลม
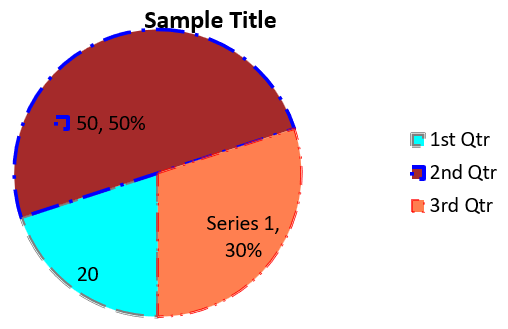
แผนภูมิวงกลมเหมาะสำหรับแสดงความสัมพันธ์ส่วนต่อส่วนของข้อมูล โดยเฉพาะเมื่อข้อมูลมีการจัดหมวดหมู่พร้อมค่าตัวเลข อย่างไรก็ตามถ้าข้อมูลของคุณมีส่วนหรือป้ายกำกับจำนวนมาก คุณอาจต้องพิจารณาใช้แผนภูมิเส้นแทน
- สร้างอินสแตนซ์ของคลาส Presentation
- รับอ้างอิงถึงสไลด์โดยใช้ตำแหน่งดัชนีของมัน
- เพิ่มแผนภูมิพร้อมข้อมูลเริ่มต้นและระบุประเภท
ChartType.Pie - เข้าถึงเวิร์กบุ๊กข้อมูลของแผนภูมิ (IChartDataWorkbook)
- ลบซีรีส์และประเภทเริ่มต้น
- เพิ่มซีรีส์และประเภทใหม่
- เพิ่มข้อมูลแผนภูมิใหม่สำหรับซีรีส์แผนภูมิ
- เพิ่มจุดใหม่ให้กับแผนภูมิและกำหนดสีตามสั่งให้กับส่วนของแผนภูมิวงกลม
- ตั้งค่าป้ายกำกับสำหรับซีรีส์
- เปิดใช้งานเส้นนำสำหรับป้ายกำกับซีรีส์
- ตั้งค่ามุมการหมุนของแผนภูมิวงกลม
- บันทึกพรีเซนเทชันที่แก้ไขเป็นไฟล์ PPTX
using System.Drawing;
using Aspose.Slides;
using Aspose.Slides.Charts;
using Aspose.Slides.Export;

// สร้างอินสแตนซ์ของคลาส Presentation.
using (Presentation presentation = new Presentation())
{
    // เข้าถึงสไลด์แรก.
    ISlide slide = presentation.Slides[0];

    // เพิ่มแผนภูมิพร้อมข้อมูลเริ่มต้น.
    IChart chart = slide.Shapes.AddChart(ChartType.Pie, 20, 20, 500, 300);

    // ตั้งค่าชื่อแผนภูมิ.
    chart.ChartTitle.AddTextFrameForOverriding("Sample Title");
    chart.ChartTitle.TextFrameForOverriding.TextFrameFormat.CenterText = NullableBool.True;
    chart.ChartTitle.Height = 20;
    chart.HasTitle = true;

    // ตั้งค่าซีรีส์แรกให้แสดงค่า.
    chart.ChartData.Series[0].Labels.DefaultDataLabelFormat.ShowValue = true;

    // ตั้งค่าดัชนีของแผ่นข้อมูลแผนภูมิ.
    int worksheetIndex = 0;

    // ดึงเวิร์กบุ๊กข้อมูลแผนภูมิ.
    IChartDataWorkbook workbook = chart.ChartData.ChartDataWorkbook;

    // ลบซีรีส์และประเภทที่สร้างโดยอัตโนมัติเริ่มต้น.
    chart.ChartData.Series.Clear();
    chart.ChartData.Categories.Clear();

    // เพิ่มประเภทใหม่.
    chart.ChartData.Categories.Add(workbook.GetCell(0, 1, 0, "1st Qtr"));
    chart.ChartData.Categories.Add(workbook.GetCell(0, 2, 0, "2nd Qtr"));
    chart.ChartData.Categories.Add(workbook.GetCell(0, 3, 0, "3rd Qtr"));

    // เพิ่มซีรีส์ใหม่.
    IChartSeries series = chart.ChartData.Series.Add(workbook.GetCell(0, 0, 1, "Series 1"), chart.Type);

    // เติมข้อมูลให้กับซีรีส์.
    series.DataPoints.AddDataPointForPieSeries(workbook.GetCell(worksheetIndex, 1, 1, 20));
    series.DataPoints.AddDataPointForPieSeries(workbook.GetCell(worksheetIndex, 2, 1, 50));
    series.DataPoints.AddDataPointForPieSeries(workbook.GetCell(worksheetIndex, 3, 1, 30));

    // ตั้งค่าสีของส่วน.
    chart.ChartData.SeriesGroups[0].IsColorVaried = true;

    IChartDataPoint point = series.DataPoints[0];
    point.Format.Fill.FillType = FillType.Solid;
    point.Format.Fill.SolidFillColor.Color = Color.Cyan;

    // ตั้งค่าขอบของส่วน.
    point.Format.Line.FillFormat.FillType = FillType.Solid;
    point.Format.Line.FillFormat.SolidFillColor.Color = Color.Gray;
    point.Format.Line.Width = 3.0;
    point.Format.Line.Style = LineStyle.ThinThick;
    point.Format.Line.DashStyle = LineDashStyle.LargeDash;

    IChartDataPoint point1 = series.DataPoints[1];
    point1.Format.Fill.FillType = FillType.Solid;
    point1.Format.Fill.SolidFillColor.Color = Color.Brown;

    // ตั้งค่าขอบของส่วน.
    point1.Format.Line.FillFormat.FillType = FillType.Solid;
    point1.Format.Line.FillFormat.SolidFillColor.Color = Color.Blue;
    point1.Format.Line.Width = 3.0;
    point1.Format.Line.Style = LineStyle.Single;
    point1.Format.Line.DashStyle = LineDashStyle.LargeDashDot;

    IChartDataPoint point2 = series.DataPoints[2];
    point2.Format.Fill.FillType = FillType.Solid;
    point2.Format.Fill.SolidFillColor.Color = Color.Coral;

    // ตั้งค่าขอบของส่วน.
    point2.Format.Line.FillFormat.FillType = FillType.Solid;
    point2.Format.Line.FillFormat.SolidFillColor.Color = Color.Red;
    point2.Format.Line.Width = 2.0;
    point2.Format.Line.Style = LineStyle.ThinThin;
    point2.Format.Line.DashStyle = LineDashStyle.LargeDashDotDot;

    // สร้างป้ายกำกับกำหนดเองสำหรับแต่ละประเภทในซีรีส์ใหม่.
    IDataLabel label1 = series.DataPoints[0].Label;

    label1.DataLabelFormat.ShowValue = true;

    IDataLabel label2 = series.DataPoints[1].Label;
    label2.DataLabelFormat.ShowValue = true;
    label2.DataLabelFormat.ShowLegendKey = true;
    label2.DataLabelFormat.ShowPercentage = true;

    IDataLabel label3 = series.DataPoints[2].Label;
    label3.DataLabelFormat.ShowSeriesName = true;
    label3.DataLabelFormat.ShowPercentage = true;

    // ตั้งค่าซีรีส์ให้แสดงเส้นนำสำหรับแผนภูมิ.
    series.Labels.DefaultDataLabelFormat.ShowLeaderLines = true;

    // ตั้งค่ามุมการหมุนของส่วนแผนภูมิวงกลม.
    chart.ChartData.SeriesGroups[0].FirstSliceAngle = 180;

    // บันทึกพรีเซนเทชันลงดิสก์เป็นไฟล์ PPTX.
    presentation.Save("PieChart_out.pptx", SaveFormat.Pptx);
}
ผลลัพธ์:
สร้างแผนภูมิเส้น
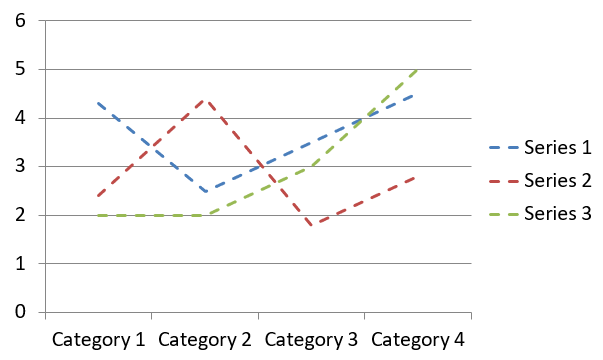
แผนภูมิเส้น (หรือที่เรียกว่ากราฟเส้น) เหมาะสำหรับแสดงการเปลี่ยนแปลงค่าตามเวลา โดยใช้แผนภูมิเส้นคุณสามารถเปรียบเทียบข้อมูลจำนวนมากในครั้งเดียว ติดตามการเปลี่ยนแปลงและแนวโน้มตามเวลา เน้นความผิดปกติในชุดข้อมูล ฯลฯ
- สร้างอินสแตนซ์ของคลาส Presentation
- รับอ้างอิงถึงสไลด์โดยใช้ตำแหน่งดัชนีของมัน
- เพิ่มแผนภูมิพร้อมข้อมูลเริ่มต้นและระบุประเภท
ChartType.Line - เข้าถึงเวิร์กบุ๊กข้อมูลของแผนภูมิ (IChartDataWorkbook)
- ลบซีรีส์และประเภทเริ่มต้น
- เพิ่มซีรีส์และประเภทใหม่
- เพิ่มข้อมูลแผนภูมิใหม่สำหรับซีรีส์แผนภูมิ
- บันทึกพรีเซนเทชันที่แก้ไขเป็นไฟล์ PPTX
using Aspose.Slides;
using Aspose.Slides.Charts;
using Aspose.Slides.Export;

using (Presentation presentation = new Presentation())
{
    IChart lineChart = presentation.Slides[0].Shapes.AddChart(ChartType.Line, 20, 20, 500, 300);

    presentation.Save("lineChart.pptx", SaveFormat.Pptx);
}
โดยค่าเริ่มต้นจุดบนแผนภูมิเส้นจะเชื่อมต่อด้วยเส้นตรงต่อเนื่อง หากต้องการให้จุดเชื่อมต่อด้วยเส้นประให้ระบุประเภทเส้นประที่ต้องการตามตัวอย่างต่อไปนี้:
using Aspose.Slides;
using Aspose.Slides.Charts;

using (Presentation presentation = new Presentation())
{
    IChart lineChart = presentation.Slides[0].Shapes.AddChart(ChartType.Line, 20, 20, 500, 300);

    foreach (IChartSeries series in lineChart.ChartData.Series)
    {
        series.Format.Line.DashStyle = LineDashStyle.Dash;
    }
}
ผลลัพธ์:
สร้างแผนภูมิต้นไม้แผนผัง
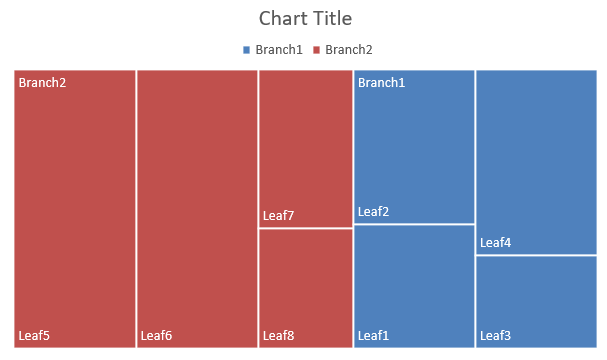
แผนภูมิต้นไม้แผนผังเหมาะสำหรับข้อมูลขายเมื่อคุณต้องการแสดงขนาดสัมพันธ์ของหมวดหมู่ข้อมูลและดึงความสนใจไปยังรายการที่เป็นผู้สนับสนุนหลักในแต่ละหมวดหมู่
- สร้างอินสแตนซ์ของคลาส Presentation
- รับอ้างอิงถึงสไลด์โดยใช้ตำแหน่งดัชนีของมัน
- เพิ่มแผนภูมิพร้อมข้อมูลเริ่มต้นและระบุประเภท
ChartType.Treemap - เข้าถึงเวิร์กบุ๊กข้อมูลของแผนภูมิ (IChartDataWorkbook)
- ลบซีรีส์และประเภทเริ่มต้น
- เพิ่มซีรีส์และประเภทใหม่
- เพิ่มข้อมูลแผนภูมิใหม่สำหรับซีรีส์แผนภูมิ
- บันทึกพรีเซนเทชันที่แก้ไขเป็นไฟล์ PPTX
using Aspose.Slides;
using Aspose.Slides.Charts;
using Aspose.Slides.Export;

using (Presentation presentation = new Presentation())
{
    IChart chart = presentation.Slides[0].Shapes.AddChart(ChartType.Treemap, 20, 20, 500, 300);
    chart.ChartData.Categories.Clear();
    chart.ChartData.Series.Clear();

    IChartDataWorkbook workbook = chart.ChartData.ChartDataWorkbook;
    workbook.Clear(0);

    // สาขา 1
    IChartCategory leaf = chart.ChartData.Categories.Add(workbook.GetCell(0, "C1", "Leaf1"));
    leaf.GroupingLevels.SetGroupingItem(1, "Stem1");
    leaf.GroupingLevels.SetGroupingItem(2, "Branch1");

    chart.ChartData.Categories.Add(workbook.GetCell(0, "C2", "Leaf2"));

    leaf = chart.ChartData.Categories.Add(workbook.GetCell(0, "C3", "Leaf3"));
    leaf.GroupingLevels.SetGroupingItem(1, "Stem2");

    chart.ChartData.Categories.Add(workbook.GetCell(0, "C4", "Leaf4"));

    // สาขา 2
    leaf = chart.ChartData.Categories.Add(workbook.GetCell(0, "C5", "Leaf5"));
    leaf.GroupingLevels.SetGroupingItem(1, "Stem3");
    leaf.GroupingLevels.SetGroupingItem(2, "Branch2");

    chart.ChartData.Categories.Add(workbook.GetCell(0, "C6", "Leaf6"));

    leaf = chart.ChartData.Categories.Add(workbook.GetCell(0, "C7", "Leaf7"));
    leaf.GroupingLevels.SetGroupingItem(1, "Stem4");

    chart.ChartData.Categories.Add(workbook.GetCell(0, "C8", "Leaf8"));

    IChartSeries series = chart.ChartData.Series.Add(ChartType.Treemap);
    series.Labels.DefaultDataLabelFormat.ShowCategoryName = true;
    series.DataPoints.AddDataPointForTreemapSeries(workbook.GetCell(0, "D1", 4));
    series.DataPoints.AddDataPointForTreemapSeries(workbook.GetCell(0, "D2", 5));
    series.DataPoints.AddDataPointForTreemapSeries(workbook.GetCell(0, "D3", 3));
    series.DataPoints.AddDataPointForTreemapSeries(workbook.GetCell(0, "D4", 6));
    series.DataPoints.AddDataPointForTreemapSeries(workbook.GetCell(0, "D5", 9));
    series.DataPoints.AddDataPointForTreemapSeries(workbook.GetCell(0, "D6", 9));
    series.DataPoints.AddDataPointForTreemapSeries(workbook.GetCell(0, "D7", 4));
    series.DataPoints.AddDataPointForTreemapSeries(workbook.GetCell(0, "D8", 3));

    series.ParentLabelLayout = ParentLabelLayoutType.Overlapping;

    presentation.Save("Treemap.pptx", SaveFormat.Pptx);
}
ผลลัพธ์:
สร้างแผนภูมิหุ้น
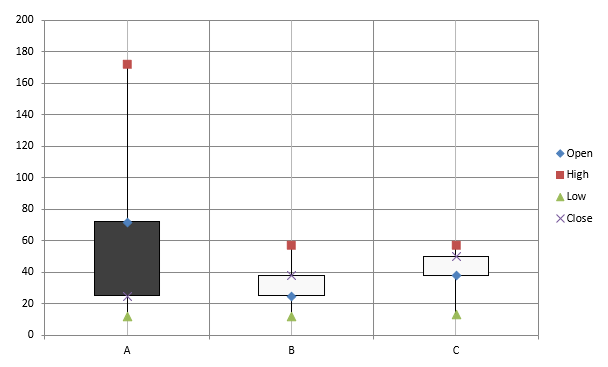
แผนภูมหุ้นใช้แสดงข้อมูลการเงินเช่น ราคาตลาดเปิด, สูง, ต่ำ, ปิด ช่วยวิเคราะห์แนวโน้มตลาดและความผันผวน ให้ข้อมูลเชิงลึกที่สำคัญต่อการทำงานของนักลงทุนและนักวิเคราะห์
- สร้างอินสแตนซ์ของคลาส Presentation
- รับอ้างอิงถึงสไลด์โดยใช้ตำแหน่งดัชนีของมัน
- เพิ่มแผนภูมิพร้อมข้อมูลเริ่มต้นและระบุประเภท
ChartType.OpenHighLowClose - เข้าถึงเวิร์กบุ๊กข้อมูลของแผนภูมิ (IChartDataWorkbook)
- ลบซีรีส์และประเภทเริ่มต้น
- เพิ่มซีรีส์และประเภทใหม่
- เพิ่มข้อมูลแผนภูมิใหม่สำหรับซีรีส์แผนภูมิ
- กำหนดรูปแบบ HiLowLines
- บันทึกพรีเซนเทชันที่แก้ไขเป็นไฟล์ PPTX
using Aspose.Slides;
using Aspose.Slides.Charts;
using Aspose.Slides.Export;

using (Presentation presentation = new Presentation())
{
    IChart chart = presentation.Slides[0].Shapes.AddChart(ChartType.OpenHighLowClose, 20, 20, 500, 300, false);

    IChartDataWorkbook workbook = chart.ChartData.ChartDataWorkbook;

    chart.ChartData.Categories.Add(workbook.GetCell(0, 1, 0, "A"));
    chart.ChartData.Categories.Add(workbook.GetCell(0, 2, 0, "B"));
    chart.ChartData.Categories.Add(workbook.GetCell(0, 3, 0, "C"));

    chart.ChartData.Series.Add(workbook.GetCell(0, 0, 1, "Open"), chart.Type);
    chart.ChartData.Series.Add(workbook.GetCell(0, 0, 2, "High"), chart.Type);
    chart.ChartData.Series.Add(workbook.GetCell(0, 0, 3, "Low"), chart.Type);
    chart.ChartData.Series.Add(workbook.GetCell(0, 0, 4, "Close"), chart.Type);

    IChartSeries series = chart.ChartData.Series[0];
    series.DataPoints.AddDataPointForStockSeries(workbook.GetCell(0, 1, 1, 72));
    series.DataPoints.AddDataPointForStockSeries(workbook.GetCell(0, 2, 1, 25));
    series.DataPoints.AddDataPointForStockSeries(workbook.GetCell(0, 3, 1, 38));

    series = chart.ChartData.Series[1];
    series.DataPoints.AddDataPointForStockSeries(workbook.GetCell(0, 1, 2, 172));
    series.DataPoints.AddDataPointForStockSeries(workbook.GetCell(0, 2, 2, 57));
    series.DataPoints.AddDataPointForStockSeries(workbook.GetCell(0, 3, 2, 57));

    series = chart.ChartData.Series[2];
    series.DataPoints.AddDataPointForStockSeries(workbook.GetCell(0, 1, 3, 12));
    series.DataPoints.AddDataPointForStockSeries(workbook.GetCell(0, 2, 3, 12));
    series.DataPoints.AddDataPointForStockSeries(workbook.GetCell(0, 3, 3, 13));

    series = chart.ChartData.Series[3];
    series.DataPoints.AddDataPointForStockSeries(workbook.GetCell(0, 1, 4, 25));
    series.DataPoints.AddDataPointForStockSeries(workbook.GetCell(0, 2, 4, 38));
    series.DataPoints.AddDataPointForStockSeries(workbook.GetCell(0, 3, 4, 50));

    chart.ChartData.SeriesGroups[0].UpDownBars.HasUpDownBars = true;
    chart.ChartData.SeriesGroups[0].HiLowLinesFormat.Line.FillFormat.FillType = FillType.Solid;

    foreach (IChartSeries ser in chart.ChartData.Series)
    {
        ser.Format.Line.FillFormat.FillType = FillType.NoFill;
    }

    chart.Axes.VerticalAxis.MinorGridLinesFormat.Line.FillFormat.FillType = FillType.NoFill;

    presentation.Save("Stock-chart.pptx", SaveFormat.Pptx);
}
ผลลัพธ์:
สร้างแผนภูมิกล่องและหวิสเกอร์
แผนภูมิกล่องและหวิสเกอร์ใช้แสดงการกระจายของข้อมูลโดยสรุปมาตรการสถิติสำคัญเช่น มัธยฐาน, ควอร์ไทล์, และค่าผิดปกติ เหมาะสำหรับการวิเคราะห์ข้อมูลสำรวจและการศึกษาทางสถิติอย่างรวดเร็ว
- สร้างอินสแตนซ์ของคลาส Presentation
- รับอ้างอิงถึงสไลด์โดยใช้ตำแหน่งดัชนีของมัน
- เพิ่มแผนภูมิพร้อมข้อมูลเริ่มต้นและระบุประเภท
ChartType.BoxAndWhisker - เข้าถึงเวิร์กบุ๊กข้อมูลของแผนภูมิ (IChartDataWorkbook)
- ลบซีรีส์และประเภทเริ่มต้น
- เพิ่มซีรีส์และประเภทใหม่
- เพิ่มข้อมูลแผนภูมิใหม่สำหรับซีรีส์แผนภูมิ
- บันทึกพรีเซนเทชันที่แก้ไขเป็นไฟล์ PPTX
using Aspose.Slides;
using Aspose.Slides.Charts;
using Aspose.Slides.Export;

using (Presentation presentation = new Presentation())
{
    IChart chart = presentation.Slides[0].Shapes.AddChart(ChartType.BoxAndWhisker, 20, 20, 500, 300);
    chart.ChartData.Categories.Clear();
    chart.ChartData.Series.Clear();

    IChartDataWorkbook workbook = chart.ChartData.ChartDataWorkbook;
    workbook.Clear(0);

    chart.ChartData.Categories.Add(workbook.GetCell(0, "A1", "Category 1"));
    chart.ChartData.Categories.Add(workbook.GetCell(0, "A2", "Category 2"));
    chart.ChartData.Categories.Add(workbook.GetCell(0, "A3", "Category 3"));
    chart.ChartData.Categories.Add(workbook.GetCell(0, "A4", "Category 4"));
    chart.ChartData.Categories.Add(workbook.GetCell(0, "A5", "Category 5"));
    chart.ChartData.Categories.Add(workbook.GetCell(0, "A6", "Category 6"));

    IChartSeries series = chart.ChartData.Series.Add(ChartType.BoxAndWhisker);

    series.QuartileMethod = QuartileMethodType.Exclusive;
    series.ShowMeanLine = true;
    series.ShowMeanMarkers = true;
    series.ShowInnerPoints = true;
    series.ShowOutlierPoints = true;

    series.DataPoints.AddDataPointForBoxAndWhiskerSeries(workbook.GetCell(0, "B1", 15));
    series.DataPoints.AddDataPointForBoxAndWhiskerSeries(workbook.GetCell(0, "B2", 41));
    series.DataPoints.AddDataPointForBoxAndWhiskerSeries(workbook.GetCell(0, "B3", 16));
    series.DataPoints.AddDataPointForBoxAndWhiskerSeries(workbook.GetCell(0, "B4", 10));
    series.DataPoints.AddDataPointForBoxAndWhiskerSeries(workbook.GetCell(0, "B5", 23));
    series.DataPoints.AddDataPointForBoxAndWhiskerSeries(workbook.GetCell(0, "B6", 16));

    presentation.Save("BoxAndWhisker.pptx", SaveFormat.Pptx);
}
สร้างแผนภูมิน้ำบ่อ
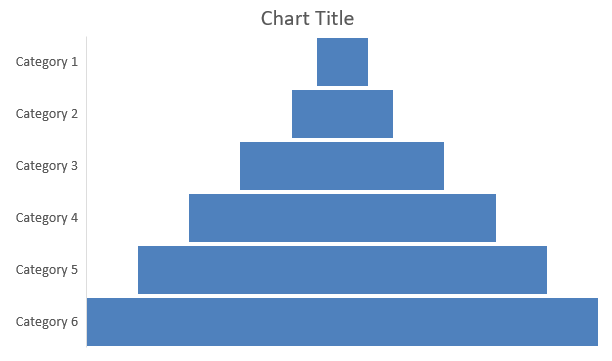
แผนภูมน้ำบ่อใช้แสดงกระบวนการที่มีขั้นตอนต่อเนื่องโดยปริมาณข้อมูลลดลงเมื่อดำเนินการจากขั้นตอนหนึ่งไปยังขั้นตอนถัดไป เหมาะสำหรับการวิเคราะห์อัตราการแปลง, ระบุคอขวด, และติดตามประสิทธิภาพของกระบวนการขายหรือการตลาด
- สร้างอินสแตนซ์ของคลาส Presentation
- รับอ้างอิงถึงสไลด์โดยใช้ตำแหน่งดัชนีของมัน
- เพิ่มแผนภูมิพร้อมข้อมูลเริ่มต้นและระบุประเภท
ChartType.Funnel - บันทึกพรีเซนเทชันที่แก้ไขเป็นไฟล์ PPTX
using Aspose.Slides;
using Aspose.Slides.Charts;
using Aspose.Slides.Export;

using (Presentation presentation = new Presentation("test.pptx"))
{
    IChart chart = presentation.Slides[0].Shapes.AddChart(ChartType.Funnel, 50, 50, 500, 400);
    chart.ChartData.Categories.Clear();
    chart.ChartData.Series.Clear();

    IChartDataWorkbook workbook = chart.ChartData.ChartDataWorkbook;
    workbook.Clear(0);

    chart.ChartData.Categories.Add(workbook.GetCell(0, "A1", "Category 1"));
    chart.ChartData.Categories.Add(workbook.GetCell(0, "A2", "Category 2"));
    chart.ChartData.Categories.Add(workbook.GetCell(0, "A3", "Category 3"));
    chart.ChartData.Categories.Add(workbook.GetCell(0, "A4", "Category 4"));
    chart.ChartData.Categories.Add(workbook.GetCell(0, "A5", "Category 5"));
    chart.ChartData.Categories.Add(workbook.GetCell(0, "A6", "Category 6"));

    IChartSeries series = chart.ChartData.Series.Add(ChartType.Funnel);

    series.DataPoints.AddDataPointForFunnelSeries(workbook.GetCell(0, "B1", 50));
    series.DataPoints.AddDataPointForFunnelSeries(workbook.GetCell(0, "B2", 100));
    series.DataPoints.AddDataPointForFunnelSeries(workbook.GetCell(0, "B3", 200));
    series.DataPoints.AddDataPointForFunnelSeries(workbook.GetCell(0, "B4", 300));
    series.DataPoints.AddDataPointForFunnelSeries(workbook.GetCell(0, "B5", 400));
    series.DataPoints.AddDataPointForFunnelSeries(workbook.GetCell(0, "B6", 500));

    presentation.Save("Funnel.pptx", SaveFormat.Pptx);
}
ผลลัพธ์:
สร้างแผนภูมิดวงอาทิตย์
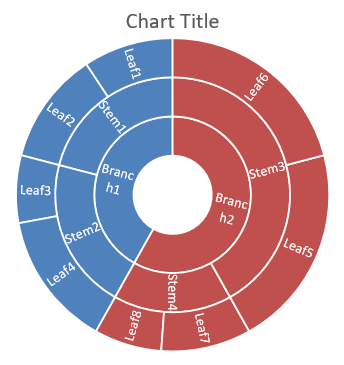
แผนภูมิดวงอาทิตย์ใช้แสดงข้อมูลเชิงลำดับขั้นโดยแสดงระดับเป็นวงทรงศูนย์ที่ล้อมรอบกัน ช่วยอธิบายความสัมพันธ์ส่วนต่อส่วนของข้อมูลและเหมาะสำหรับการแทนหมวดหมู่ย่อยหรือหมวดหมู่ที่ซ้อนกันในรูปแบบที่กระชับ
- สร้างอินสแตนซ์ของคลาส Presentation
- รับอ้างอิงถึงสไลด์โดยใช้ตำแหน่งดัชนีของมัน
- เพิ่มแผนภูมิพร้อมข้อมูลเริ่มต้นและระบุประเภท
ChartType.Sunburst - บันทึกพรีเซนเทชันที่แก้ไขเป็นไฟล์ PPTX
using Aspose.Slides;
using Aspose.Slides.Charts;
using Aspose.Slides.Export;

using (Presentation presentation = new Presentation())
{
    IChart chart = presentation.Slides[0].Shapes.AddChart(ChartType.Sunburst, 20, 20, 500, 300);
    chart.ChartData.Categories.Clear();
    chart.ChartData.Series.Clear();

    IChartDataWorkbook workbook = chart.ChartData.ChartDataWorkbook;
    workbook.Clear(0);

    // สาขา 1
    IChartCategory leaf = chart.ChartData.Categories.Add(workbook.GetCell(0, "C1", "Leaf1"));
    leaf.GroupingLevels.SetGroupingItem(1, "Stem1");
    leaf.GroupingLevels.SetGroupingItem(2, "Branch1");

    chart.ChartData.Categories.Add(workbook.GetCell(0, "C2", "Leaf2"));

    leaf = chart.ChartData.Categories.Add(workbook.GetCell(0, "C3", "Leaf3"));
    leaf.GroupingLevels.SetGroupingItem(1, "Stem2");

    chart.ChartData.Categories.Add(workbook.GetCell(0, "C4", "Leaf4"));

    // สาขา 2
    leaf = chart.ChartData.Categories.Add(workbook.GetCell(0, "C5", "Leaf5"));
    leaf.GroupingLevels.SetGroupingItem(1, "Stem3");
    leaf.GroupingLevels.SetGroupingItem(2, "Branch2");

    chart.ChartData.Categories.Add(workbook.GetCell(0, "C6", "Leaf6"));

    leaf = chart.ChartData.Categories.Add(workbook.GetCell(0, "C7", "Leaf7"));
    leaf.GroupingLevels.SetGroupingItem(1, "Stem4");

    chart.ChartData.Categories.Add(workbook.GetCell(0, "C8", "Leaf8"));

    IChartSeries series = chart.ChartData.Series.Add(ChartType.Sunburst);
    series.Labels.DefaultDataLabelFormat.ShowCategoryName = true;
    series.DataPoints.AddDataPointForSunburstSeries(workbook.GetCell(0, "D1", 4));
    series.DataPoints.AddDataPointForSunburstSeries(workbook.GetCell(0, "D2", 5));
    series.DataPoints.AddDataPointForSunburstSeries(workbook.GetCell(0, "D3", 3));
    series.DataPoints.AddDataPointForSunburstSeries(workbook.GetCell(0, "D4", 6));
    series.DataPoints.AddDataPointForSunburstSeries(workbook.GetCell(0, "D5", 9));
    series.DataPoints.AddDataPointForSunburstSeries(workbook.GetCell(0, "D6", 9));
    series.DataPoints.AddDataPointForSunburstSeries(workbook.GetCell(0, "D7", 4));
    series.DataPoints.AddDataPointForSunburstSeries(workbook.GetCell(0, "D8", 3));

    presentation.Save("Sunburst.pptx", SaveFormat.Pptx);
}
ผลลัพธ์:
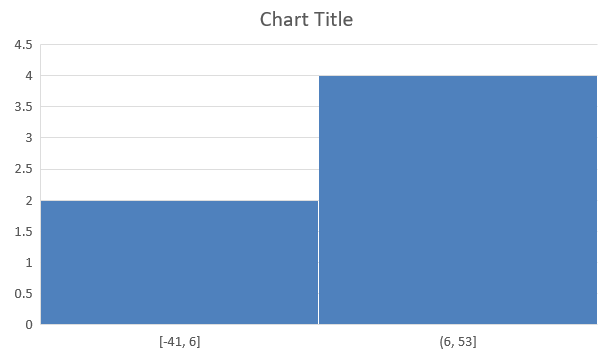
สร้างแผนภูมิฮิสโตแกรม
แผนภูมิฮิสโตแกรมใช้แสดงการกระจายของข้อมูลตัวเลขโดยจัดกลุ่มค่าเป็นช่วงหรือตะกร้า ช่วยระบุรูปแบบความถี่, ความเอนเอียง, การกระจาย และตรวจจับค่าผิดปกติในชุดข้อมูล
- สร้างอินสแตนซ์ของคลาส Presentation
- รับอ้างอิงถึงสไลด์โดยใช้ตำแหน่งดัชนีของมัน
- เพิ่มแผนภูมิพร้อมข้อมูลบางส่วนและระบุประเภท
ChartType.Histogram - เข้าถึงเวิร์กบุ๊กข้อมูลของแผนภูมิ (IChartDataWorkbook)
- ลบซีรีส์และประเภทเริ่มต้น
- เพิ่มซีรีส์และประเภทใหม่
- บันทึกพรีเซนเทชันที่แก้ไขเป็นไฟล์ PPTX
using Aspose.Slides;
using Aspose.Slides.Charts;
using Aspose.Slides.Export;

using (Presentation presentation = new Presentation())
{
    IChart chart = presentation.Slides[0].Shapes.AddChart(ChartType.Histogram, 20, 20, 500, 300);
    chart.ChartData.Categories.Clear();
    chart.ChartData.Series.Clear();

    IChartDataWorkbook workbook = chart.ChartData.ChartDataWorkbook;
    workbook.Clear(0);

    IChartSeries series = chart.ChartData.Series.Add(ChartType.Histogram);
    series.DataPoints.AddDataPointForHistogramSeries(workbook.GetCell(0, "A1", 15));
    series.DataPoints.AddDataPointForHistogramSeries(workbook.GetCell(0, "A2", -41));
    series.DataPoints.AddDataPointForHistogramSeries(workbook.GetCell(0, "A3", 16));
    series.DataPoints.AddDataPointForHistogramSeries(workbook.GetCell(0, "A4", 10));
    series.DataPoints.AddDataPointForHistogramSeries(workbook.GetCell(0, "A5", -23));
    series.DataPoints.AddDataPointForHistogramSeries(workbook.GetCell(0, "A6", 16));

    chart.Axes.HorizontalAxis.AggregationType = AxisAggregationType.Automatic;

    presentation.Save("Histogram.pptx", SaveFormat.Pptx);
}
ผลลัพธ์:
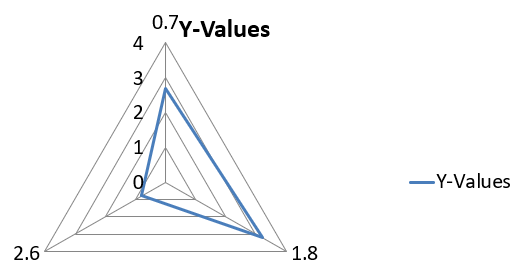
สร้างแผนภูมิเสาเรดาร์
แผนภูมิเสาเรดาร์ใช้แสดงข้อมูลหลายตัวแปรในรูปแบบสองมิติ ทำให้เปรียบเทียบหลายตัวแปรพร้อมกันได้ง่าย เหมาะสำหรับระบุรูปแบบ, จุดแข็ง, จุดอ่อนของเมตริกหรือคุณลักษณะหลาย ๆ อย่าง
- สร้างอินสแตนซ์ของคลาส Presentation
- รับอ้างอิงถึงสไลด์โดยใช้ตำแหน่งดัชนีของมัน
- เพิ่มแผนภูมิพร้อมข้อมูลบางส่วนและระบุประเภท
ChartType.Radar - บันทึกพรีเซนเทชันที่แก้ไขเป็นไฟล์ PPTX
using Aspose.Slides;
using Aspose.Slides.Charts;
using Aspose.Slides.Export;

using (Presentation presentation = new Presentation())
{
    presentation.Slides[0].Shapes.AddChart(ChartType.Radar, 20, 20, 500, 300);
    presentation.Save("Radar-chart.pptx", SaveFormat.Pptx);
}
ผลลัพธ์:
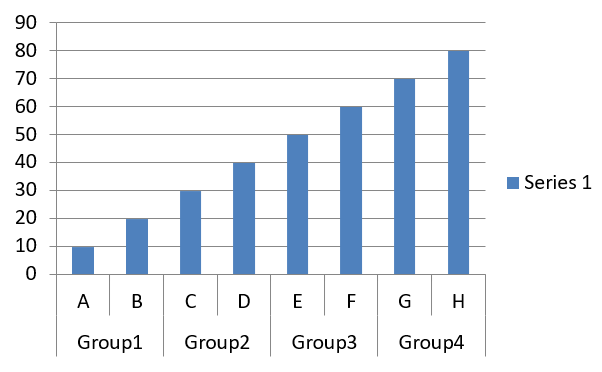
สร้างแผนภูมิหลายประเภท
แผนภูมิหลายประเภทใช้แสดงข้อมูลที่มีการจัดกลุ่มหมวดหมู่มากกว่าหนึ่งชุด เพื่อเปรียบเทียบค่าข้ามมิติหลาย ๆ อย่างพร้อมกัน เหมาะสำหรับการวิเคราะห์แนวโน้มและความสัมพันธ์ในชุดข้อมูลที่ซับซ้อนหลายระดับ
- สร้างอินสแตนซ์ของคลาส Presentation
- รับอ้างอิงถึงสไลด์โดยใช้ตำแหน่งดัชนีของมัน
- เพิ่มแผนภูมิพร้อมข้อมูลเริ่มต้นและระบุประเภท
ChartType.ClusteredColumn - เข้าถึงเวิร์กบุ๊กข้อมูลของแผนภูมิ (IChartDataWorkbook)
- ลบซีรีส์และประเภทเริ่มต้น
- เพิ่มซีรีส์และประเภทใหม่
- เพิ่มข้อมูลแผนภูมิใหม่สำหรับซีรีส์แผนภูมิ
- บันทึกพรีเซนเทชันที่แก้ไขเป็นไฟล์ PPTX
using Aspose.Slides;
using Aspose.Slides.Charts;
using Aspose.Slides.Export;

using (Presentation presentation = new Presentation())
{
    ISlide slide = presentation.Slides[0];

    IChart chart = presentation.Slides[0].Shapes.AddChart(ChartType.ClusteredColumn, 20, 20, 500, 300);
    chart.ChartData.Series.Clear();
    chart.ChartData.Categories.Clear();

    IChartDataWorkbook workbook = chart.ChartData.ChartDataWorkbook;
    workbook.Clear(0);

    int worksheetIndex = 0;

    IChartCategory category = chart.ChartData.Categories.Add(workbook.GetCell(0, "c2", "A"));
    category.GroupingLevels.SetGroupingItem(1, "Group1");
    category = chart.ChartData.Categories.Add(workbook.GetCell(0, "c3", "B"));

    category = chart.ChartData.Categories.Add(workbook.GetCell(0, "c4", "C"));
    category.GroupingLevels.SetGroupingItem(1, "Group2");
    category = chart.ChartData.Categories.Add(workbook.GetCell(0, "c5", "D"));

    category = chart.ChartData.Categories.Add(workbook.GetCell(0, "c6", "E"));
    category.GroupingLevels.SetGroupingItem(1, "Group3");
    category = chart.ChartData.Categories.Add(workbook.GetCell(0, "c7", "F"));

    category = chart.ChartData.Categories.Add(workbook.GetCell(0, "c8", "G"));
    category.GroupingLevels.SetGroupingItem(1, "Group4");
    category = chart.ChartData.Categories.Add(workbook.GetCell(0, "c9", "H"));

    // เพิ่มซีรีส์.
    IChartSeries series = chart.ChartData.Series.Add(workbook.GetCell(0, "D1", "Series 1"), ChartType.ClusteredColumn);

    series.DataPoints.AddDataPointForBarSeries(workbook.GetCell(worksheetIndex, "D2", 10));
    series.DataPoints.AddDataPointForBarSeries(workbook.GetCell(worksheetIndex, "D3", 20));
    series.DataPoints.AddDataPointForBarSeries(workbook.GetCell(worksheetIndex, "D4", 30));
    series.DataPoints.AddDataPointForBarSeries(workbook.GetCell(worksheetIndex, "D5", 40));
    series.DataPoints.AddDataPointForBarSeries(workbook.GetCell(worksheetIndex, "D6", 50));
    series.DataPoints.AddDataPointForBarSeries(workbook.GetCell(worksheetIndex, "D7", 60));
    series.DataPoints.AddDataPointForBarSeries(workbook.GetCell(worksheetIndex, "D8", 70));
    series.DataPoints.AddDataPointForBarSeries(workbook.GetCell(worksheetIndex, "D9", 80));

    // บันทึกพรีเซนเทชันพร้อมแผนภูมิ.
    presentation.Save("AsposeChart_out.pptx", SaveFormat.Pptx);
}
ผลลัพธ์:
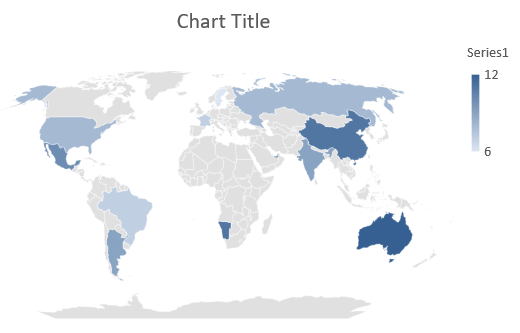
สร้างแผนภูมิเพรติบำรุงแผนที่
แผนภูมิเพรติบำรุงแผนที่ใช้แสดงข้อมูลทางภูมิศาสตร์โดยทำแมพข้อมูลไปยังตำแหน่งเฉพาะเช่น ประเทศ, รัฐ หรือเมือง เหมาะสำหรับวิเคราะห์แนวโน้มภูมิภาค, ข้อมูลประชากร, การกระจายเชิงพื้นที่ในรูปแบบที่ชัดเจนและดึงดูดสายตา
using Aspose.Slides;
using Aspose.Slides.Charts;
using Aspose.Slides.Export;

using (Presentation presentation = new Presentation())
{
    IChart chart = presentation.Slides[0].Shapes.AddChart(ChartType.Map, 20, 20, 500, 300);
    presentation.Save("mapChart.pptx", SaveFormat.Pptx);
}
ผลลัพธ์:
สร้างแผนภูมิกำหนดรวม
แผนภูมิกำหนดรวม (หรือ combo chart) รวมประเภทแผนภูมิกี่ประเภทในกราฟเดียว ช่วยให้คุณเน้น, เปรียบเทียบ หรือวิเคราะห์ความแตกต่างระหว่างชุดข้อมูลหลายชุด เพื่อระบุความสัมพันธ์ระหว่างกัน
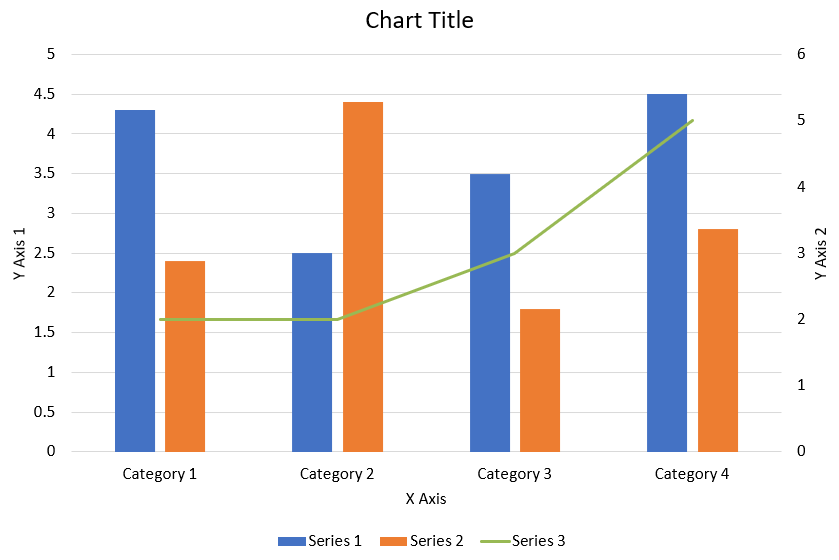
โค้ด C# ต่อไปนี้แสดงวิธีสร้างแผนภูมิกำหนดรวมที่แสดงด้านบนในพรีเซนเทชัน PowerPoint:
using Aspose.Slides;
using Aspose.Slides.Charts;
using Aspose.Slides.Export;

private static void CreateComboChart()
{
    using (Presentation presentation = new Presentation())
    {
        IChart chart = CreateChartWithFirstSeries(presentation.Slides[0]);

        AddSecondSeriesToChart(chart);
        AddThirdSeriesToChart(chart);

        SetPrimaryAxesFormat(chart);
        SetSecondaryAxesFormat(chart);

        presentation.Save("combo-chart.pptx", SaveFormat.Pptx);
    }
}

private static IChart CreateChartWithFirstSeries(ISlide slide)
{
    IChart chart = slide.Shapes.AddChart(ChartType.ClusteredColumn, 50, 50, 600, 400);

    // ตั้งค่าชื่อแผนภูมิ
    chart.HasTitle = true;
    chart.ChartTitle.AddTextFrameForOverriding("Chart Title");
    chart.ChartTitle.Overlay = false;
    IPortionFormat portionFormat =
       chart.ChartTitle.TextFrameForOverriding.Paragraphs[0].ParagraphFormat.DefaultPortionFormat;
    portionFormat.FontBold = NullableBool.False;
    portionFormat.FontHeight = 18f;

    // ตั้งค่าตัวอธิบายแผนภูมิ
    chart.Legend.Position = LegendPositionType.Bottom;
    chart.Legend.TextFormat.PortionFormat.FontHeight = 12f;

    // ลบซีรีส์และประเภทที่สร้างโดยอัตโนมัติเริ่มต้น
    chart.ChartData.Series.Clear();
    chart.ChartData.Categories.Clear();

    int worksheetIndex = 0;
    IChartDataWorkbook workbook = chart.ChartData.ChartDataWorkbook;

    // เพิ่มประเภทใหม่
    chart.ChartData.Categories.Add(workbook.GetCell(worksheetIndex, 1, 0, "Category 1"));
    chart.ChartData.Categories.Add(workbook.GetCell(worksheetIndex, 2, 0, "Category 2"));
    chart.ChartData.Categories.Add(workbook.GetCell(worksheetIndex, 3, 0, "Category 3"));
    chart.ChartData.Categories.Add(workbook.GetCell(worksheetIndex, 4, 0, "Category 4"));

    // เพิ่มซีรีส์แรก
    IChartSeries series = chart.ChartData.Series.Add(
        workbook.GetCell(worksheetIndex, 0, 1, "Series 1"), chart.Type);

    series.ParentSeriesGroup.Overlap = -25;
    series.ParentSeriesGroup.GapWidth = 220;

    series.DataPoints.AddDataPointForBarSeries(workbook.GetCell(worksheetIndex, 1, 1, 4.3));
    series.DataPoints.AddDataPointForBarSeries(workbook.GetCell(worksheetIndex, 2, 1, 2.5));
    series.DataPoints.AddDataPointForBarSeries(workbook.GetCell(worksheetIndex, 3, 1, 3.5));
    series.DataPoints.AddDataPointForBarSeries(workbook.GetCell(worksheetIndex, 4, 1, 4.5));

    return chart;
}

private static void AddSecondSeriesToChart(IChart chart)
{
    IChartDataWorkbook workbook = chart.ChartData.ChartDataWorkbook;
    const int worksheetIndex = 0;

    IChartSeries series = chart.ChartData.Series.Add(
        workbook.GetCell(worksheetIndex, 0, 2, "Series 2"), ChartType.ClusteredColumn);

    series.ParentSeriesGroup.Overlap = -25;
    series.ParentSeriesGroup.GapWidth = 220;

    series.DataPoints.AddDataPointForBarSeries(workbook.GetCell(worksheetIndex, 1, 2, 2.4));
    series.DataPoints.AddDataPointForBarSeries(workbook.GetCell(worksheetIndex, 2, 2, 4.4));
    series.DataPoints.AddDataPointForBarSeries(workbook.GetCell(worksheetIndex, 3, 2, 1.8));
    series.DataPoints.AddDataPointForBarSeries(workbook.GetCell(worksheetIndex, 4, 2, 2.8));
}

private static void AddThirdSeriesToChart(IChart chart)
{
    IChartDataWorkbook workbook = chart.ChartData.ChartDataWorkbook;
    const int worksheetIndex = 0;

    IChartSeries series = chart.ChartData.Series.Add(
        workbook.GetCell(worksheetIndex, 0, 3, "Series 3"), ChartType.Line);

    series.DataPoints.AddDataPointForLineSeries(workbook.GetCell(worksheetIndex, 1, 3, 2.0));
    series.DataPoints.AddDataPointForLineSeries(workbook.GetCell(worksheetIndex, 2, 3, 2.0));
    series.DataPoints.AddDataPointForLineSeries(workbook.GetCell(worksheetIndex, 3, 3, 3.0));
    series.DataPoints.AddDataPointForLineSeries(workbook.GetCell(worksheetIndex, 4, 3, 5.0));

    series.PlotOnSecondAxis = true;
}

private static void SetPrimaryAxesFormat(IChart chart)
{
    // ตั้งค่าแกนแนวนอน
    IAxis horizontalAxis = chart.Axes.HorizontalAxis;
    horizontalAxis.TextFormat.PortionFormat.FontHeight = 12f;
    horizontalAxis.Format.Line.FillFormat.FillType = FillType.NoFill;

    SetAxisTitle(horizontalAxis, "X Axis");

    // ตั้งค่าแกนแนวตั้ง
    IAxis verticalAxis = chart.Axes.VerticalAxis;
    verticalAxis.TextFormat.PortionFormat.FontHeight = 12f;
    verticalAxis.Format.Line.FillFormat.FillType = FillType.NoFill;

    SetAxisTitle(verticalAxis, "Y Axis 1");

    // ตั้งค่าสีเส้นกริดหลักแนวตั้ง
    ILineFillFormat majorGridLinesFormat = verticalAxis.MajorGridLinesFormat.Line.FillFormat;
    majorGridLinesFormat.FillType = FillType.Solid;
    majorGridLinesFormat.SolidFillColor.Color = Color.FromArgb(217, 217, 217);
}

private static void SetSecondaryAxesFormat(IChart chart)
{
    // ตั้งค่าแกนแนวนอนรอง
    IAxis secondaryHorizontalAxis = chart.Axes.SecondaryHorizontalAxis;
    secondaryHorizontalAxis.Position = AxisPositionType.Bottom;
    secondaryHorizontalAxis.CrossType = CrossesType.Maximum;
    secondaryHorizontalAxis.IsVisible = false;
    secondaryHorizontalAxis.MajorGridLinesFormat.Line.FillFormat.FillType = FillType.NoFill;
    secondaryHorizontalAxis.MinorGridLinesFormat.Line.FillFormat.FillType = FillType.NoFill;

    // ตั้งค่าแกนแนวตั้งรอง
    IAxis secondaryVerticalAxis = chart.Axes.SecondaryVerticalAxis;
    secondaryVerticalAxis.Position = AxisPositionType.Right;
    secondaryVerticalAxis.TextFormat.PortionFormat.FontHeight = 12f;
    secondaryVerticalAxis.Format.Line.FillFormat.FillType = FillType.NoFill;
    secondaryVerticalAxis.MajorGridLinesFormat.Line.FillFormat.FillType = FillType.NoFill;
    secondaryVerticalAxis.MinorGridLinesFormat.Line.FillFormat.FillType = FillType.NoFill;

    SetAxisTitle(secondaryVerticalAxis, "Y Axis 2");
}

private static void SetAxisTitle(IAxis axis, string axisTitle)
{
    axis.HasTitle = true;
    axis.Title.Overlay = false;
    IPortionFormat titlePortionFormat =
        axis.Title.AddTextFrameForOverriding(axisTitle).Paragraphs[0].ParagraphFormat.DefaultPortionFormat;
    titlePortionFormat.FontBold = NullableBool.False;
    titlePortionFormat.FontHeight = 12f;
}
อัปเดตแผนภูมิ
Aspose.Slides สำหรับ .NET ช่วยให้คุณอัปเดตแผนภูมิ PowerPoint ได้โดยแก้ไขข้อมูลแผนภูมิ, การจัดรูปแบบและสไตล์ ฟังก์ชันนี้ทำให้การรักษาพรีเซนเทชันให้เป็นปัจจุบันด้วยเนื้อหาแบบไดนามิกเป็นเรื่องง่ายและทำให้แผนภูมิสะท้อนข้อมูลและมาตรฐานการแสดงผลล่าสุดได้อย่างแม่นยำ
- สร้างอินสแตนซ์ของคลาส Presentation ที่เป็นตัวแทนพรีเซนเทชันที่มีแผนภูมิ
- รับอ้างอิงถึงสไลด์โดยใช้ตำแหน่งดัชนีของมัน
- วนลูปผ่านทุกรูปร่างเพื่อค้นหาแผนภูมิ
- เข้าถึงเวิร์กชีตข้อมูลของแผนภูมิ
- แก้ไขซีรีส์ข้อมูลแผนภูมิโดยเปลี่ยนค่าของซีรีส์
- เพิ่มซีรีส์ใหม่และกรอกข้อมูลของมัน
- บันทึกพรีเซนเทชันที่แก้ไขเป็นไฟล์ PPTX
using Aspose.Slides;
using Aspose.Slides.Charts;
using Aspose.Slides.Export;

const string chartName = "My chart";

// สร้างอินสแตนซ์ของคลาส Presentation ที่แสดงถึงไฟล์ PPTX
using (Presentation presentation = new Presentation("ExistingChart.pptx"))
{
    // เข้าถึงสไลด์แรก
    ISlide slide = presentation.Slides[0];

    foreach (IShape shape in slide.Shapes)
    {
        if (shape is IChart chart && chart.Name == chartName)
        {
            // ตั้งค่าดัชนีของแผ่นข้อมูลแผนภูมิ
            int worksheetIndex = 0;

            // ดึงเวิร์กบุ๊กข้อมูลแผนภูมิ
            IChartDataWorkbook workbook = chart.ChartData.ChartDataWorkbook;

            // เปลี่ยนชื่อหมวดหมู่ของแผนภูมิ
            workbook.GetCell(worksheetIndex, 1, 0, "Modified Category 1");
            workbook.GetCell(worksheetIndex, 2, 0, "Modified Category 2");

            // ดึงซีรีส์แผนภูม้อันดับแรก
            IChartSeries series = chart.ChartData.Series[0];

            // อัปเดตข้อมูลของซีรีส์
            workbook.GetCell(worksheetIndex, 0, 1, "New_Series 1"); // แก้ไขชื่อซีรีส์
            series.DataPoints[0].Value.Data = 90;
            series.DataPoints[1].Value.Data = 123;
            series.DataPoints[2].Value.Data = 44;

            // ดึงซีรีส์แผนภูมิที่สอง
            series = chart.ChartData.Series[1];

            // อัปเดตข้อมูลของซีรีส์
            workbook.GetCell(worksheetIndex, 0, 2, "New_Series 2"); // แก้ไขชื่อซีรีส์
            series.DataPoints[0].Value.Data = 23;
            series.DataPoints[1].Value.Data = 67;
            series.DataPoints[2].Value.Data = 99;

            // เพิ่มซีรีส์ใหม่
            series = chart.ChartData.Series.Add(workbook.GetCell(worksheetIndex, 0, 3, "Series 3"), chart.Type);

            // เติมข้อมูลให้กับซีรีส์
            series.DataPoints.AddDataPointForBarSeries(workbook.GetCell(worksheetIndex, 1, 3, 20));
            series.DataPoints.AddDataPointForBarSeries(workbook.GetCell(worksheetIndex, 2, 3, 50));
            series.DataPoints.AddDataPointForBarSeries(workbook.GetCell(worksheetIndex, 3, 3, 30));

            chart.Type = ChartType.ClusteredCylinder;
        }
    }

    // บันทึกพรีเซนเทชันพร้อมแผนภูมิ
    presentation.Save("AsposeChartModified_out.pptx", SaveFormat.Pptx);
}
กำหนดช่วงข้อมูลสำหรับแผนภูมิ
เพื่อดูช่วงที่ใช้แล้วโดยแผนภูมิมีอยู่แล้ว ให้ดูที่ ดึงข้อมูลช่วงของแผนภูมิ
Aspose.Slides สำหรับ .NET ให้ความยืดหยุ่นในการกำหนดช่วงข้อมูลเฉพาะจากเวิร์กชีตเป็นแหล่งข้อมูลสำหรับแผนภูมิ นั่นหมายความว่าคุณสามารถแมปส่วนของเวิร์กชีตโดยตรงไปยังแผนภูมิได้ ทำให้ควบคุมเซลล์ที่ส่งผลต่อซีรีส์และประเภทของแผนภูมิได้อย่างแม่นยำ และช่วยให้คุณอัปเดตและซิงโครไนซ์แผนภูมิเมื่อข้อมูลในเวิร์กชีตเปลี่ยนแปลง
- สร้างอินสแตนซ์ของคลาส Presentation ที่เป็นตัวแทนพรีเซนเทชันที่มีแผนภูมิ
- รับอ้างอิงถึงสไลด์โดยใช้ตำแหน่งดัชนีของมัน
- วนลูปผ่านทุกรูปร่างเพื่อค้นหาแผนภูมิ
- เข้าถึงข้อมูลแผนภูมิและตั้งค่าช่วง
- บันทึกพรีเซนเทชันที่แก้ไขเป็นไฟล์ PPTX
using Aspose.Slides;
using Aspose.Slides.Charts;
using Aspose.Slides.Export;

const string chartName = "My chart";

// สร้างอินสแตนซ์ของคลาส Presentation ที่แสดงถึงไฟล์ PPTX
using (Presentation presentation = new Presentation("ExistingChart.pptx"))
{
    // เข้าถึงสไลด์แรก.
    ISlide slide = presentation.Slides[0];

    foreach (IShape shape in slide.Shapes)
    {
        if (shape is IChart chart && chart.Name == chartName)
        {
            chart.ChartData.SetRange("Sheet1!A1:B4");
        }
    }

    presentation.Save("SetDataRange_out.pptx", SaveFormat.Pptx);
}
ใช้ตัวทำเครื่องหมายเริ่มต้นในแผนภูมิ
เมื่อใช้ตัวทำเครื่องหมายเริ่มต้นในแผนภูมิแต่ละซีรีส์จะได้รับสัญลักษณ์เริ่มต้นที่ต่างกันโดยอัตโนมัติ
โค้ด C# นี้แสดงวิธีตั้งค่าตัวทำเครื่องหมายของซีรีส์แผนภูมิโดยอัตโนมัติ:
using Aspose.Slides;
using Aspose.Slides.Charts;
using Aspose.Slides.Export;

using (Presentation presentation = new Presentation())
{
    ISlide slide = presentation.Slides[0];
    IChart chart = slide.Shapes.AddChart(ChartType.LineWithMarkers, 10, 10, 400, 400);

    chart.ChartData.Series.Clear();
    chart.ChartData.Categories.Clear();

    IChartDataWorkbook workbook = chart.ChartData.ChartDataWorkbook;

    IChartSeries series = chart.ChartData.Series.Add(workbook.GetCell(0, 0, 1, "Series 1"), chart.Type);

    chart.ChartData.Categories.Add(workbook.GetCell(0, 1, 0, "C1"));
    series.DataPoints.AddDataPointForLineSeries(workbook.GetCell(0, 1, 1, 24));

    chart.ChartData.Categories.Add(workbook.GetCell(0, 2, 0, "C2"));
    series.DataPoints.AddDataPointForLineSeries(workbook.GetCell(0, 2, 1, 23));

    chart.ChartData.Categories.Add(workbook.GetCell(0, 3, 0, "C3"));
    series.DataPoints.AddDataPointForLineSeries(workbook.GetCell(0, 3, 1, -10));

    chart.ChartData.Categories.Add(workbook.GetCell(0, 4, 0, "C4"));
    series.DataPoints.AddDataPointForLineSeries(workbook.GetCell(0, 4, 1, null));

    IChartSeries series2 = chart.ChartData.Series.Add(workbook.GetCell(0, 0, 2, "Series 2"), chart.Type);

    // เติมข้อมูลให้กับซีรีส์.
    series2.DataPoints.AddDataPointForLineSeries(workbook.GetCell(0, 1, 2, 30));
    series2.DataPoints.AddDataPointForLineSeries(workbook.GetCell(0, 2, 2, 10));
    series2.DataPoints.AddDataPointForLineSeries(workbook.GetCell(0, 3, 2, 60));
    series2.DataPoints.AddDataPointForLineSeries(workbook.GetCell(0, 4, 2, 40));

    chart.HasLegend = true;
    chart.Legend.Overlay = false;

    presentation.Save("DefaultMarkersInChart.pptx", SaveFormat.Pptx);
}
คำถามที่พบบ่อย
Aspose.Slides สำหรับ .NET รองรับประเภทแผนภูมิใดบ้าง?
Aspose.Slides สำหรับ .NET รองรับประเภทแผนภูมิหลากหลายรวมถึงแถบ, เส้น, วงกลม, พื้นที่, กระจาย, ฮิสโตแกรม, เรเดอร์ และอื่น ๆ อีกมาก ความยืดหยุ่นนี้ทำให้คุณเลือกประเภทแผนภูมิที่เหมาะสมกับการแสดงผลข้อมูลของคุณได้
ฉันจะเพิ่มแผนภูมิใหม่ลงในสไลด์อย่างไร?
เพื่อเพิ่มแผนภูมิ คุณต้องสร้างอินสแตนซ์ของคลาส Presentation แล้วดึงสไลด์ที่ต้องการโดยใช้ตำแหน่งดัชนี จากนั้นเรียกเมธอดเพื่อเพิ่มแผนภูมิ โดยระบุประเภทแผนภูมิและข้อมูลเริ่มต้น กระบวนการนี้รวมแผนภูมิเข้าไปในพรีเซนเทชันโดยตรง
ฉันจะอัปเดตข้อมูลที่แสดงในแผนภูมิได้อย่างไร?
คุณสามารถอัปเดตข้อมูลของแผนภูมิได้โดยเข้าถึงเวิร์กบุ๊กข้อมูลของแผนภูมิ (IChartDataWorkbook) ลบซีรีส์และประเภทเริ่มต้น แล้วเพิ่มข้อมูลที่กำหนดเองของคุณ สิ่งนี้ทำให้คุณรีเฟรชแผนภูมิผ่านโค้ดให้สอดคล้องกับข้อมูลล่าสุด
สามารถปรับแต่งลักษณะของแผนภูมิได้หรือไม่?
ได้ Aspose.Slides สำหรับ .NET มีตัวเลือกการปรับแต่งที่หลากหลาย คุณสามารถแก้ไขสี, ฟอนต์, ป้ายกำกับ, คำอธิบายและองค์ประกอบการจัดรูปแบบอื่น ๆ เพื่อให้แผนภูมิตรงตามข้อกำหนดการออกแบบของคุณได้อย่างละเอียด