Analyzing your prompt, please hold on...
An error occurred while retrieving the results. Please refresh the page and try again.
A treemap chart provides a hierarchical view of your data and makes it easy to spot patterns, such as which items are the store’s best sellers. The tree branches are represented by rectangles, and each sub‑branch is shown as a smaller rectangle. The treemap chart displays categories by color and proximity, and can easily show large amounts of data that would be difficult to present with other chart types.
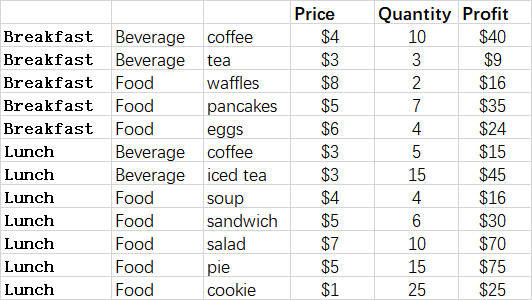
After running the code below, you will see the TreeMap chart as shown below.

The following sample code loads the sample Excel file and generates the output Excel file.
Analyzing your prompt, please hold on...
An error occurred while retrieving the results. Please refresh the page and try again.