Analyzing your prompt, please hold on...
An error occurred while retrieving the results. Please refresh the page and try again.
A PivotChart in Excel is a graphical representation of data created from a PivotTable. It allows users to visualize and analyze data dynamically by summarizing and displaying information in chart form. PivotCharts are interactive and can be easily modified to show different perspectives of the data, making it a powerful tool for data analysis and presentation in Excel.
By using Aspose.Cells, you can use Aspose.Cells.Charts.PivotOptions to manage a PivotChart.
Sample file and code:
Sample File
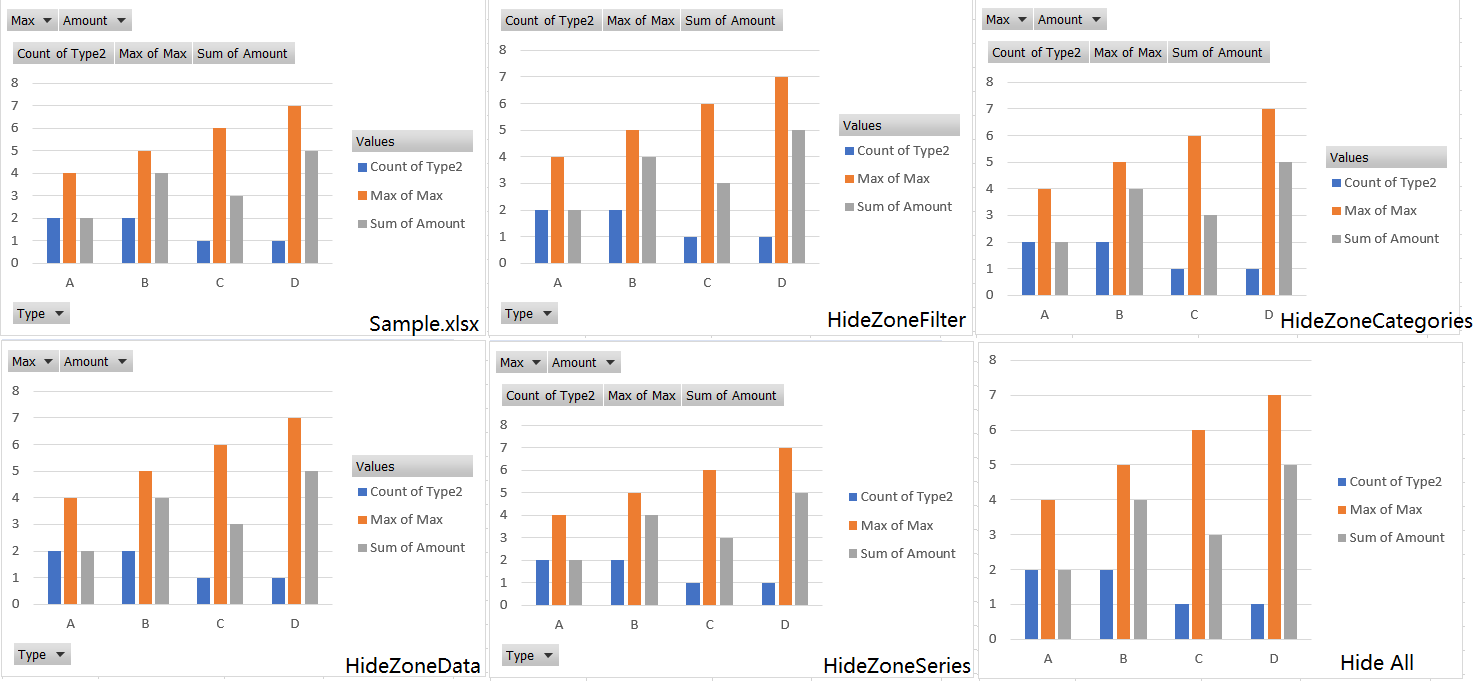
With the example code above, you can view the resulting file, which has the following effect, as shown in the figure:
Analyzing your prompt, please hold on...
An error occurred while retrieving the results. Please refresh the page and try again.