Analyzing your prompt, please hold on...
An error occurred while retrieving the results. Please refresh the page and try again.
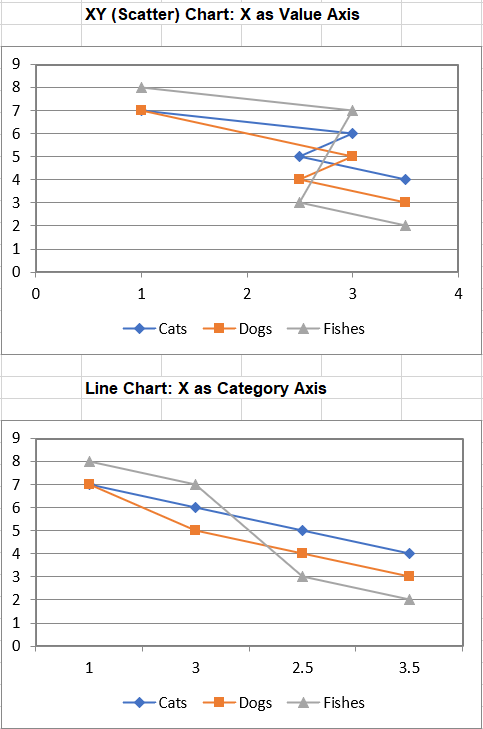
There are different types of X axes. While the Y axis is a Value‑type axis, the X axis can be a Category‑type axis or a Value‑type axis. Using a Value axis, the data is treated as continuously varying numerical data, and the marker is placed at a point along the axis that varies according to its numerical value. Using a Category axis, the data is treated as a sequence of non‑numerical text labels, and the marker is placed at a point along the axis according to its position in the sequence. The sample below illustrates the difference between Value and Category axes.
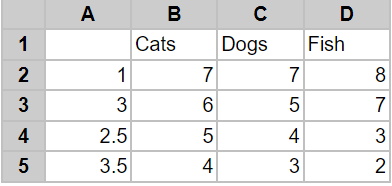
Our sample data is shown in the sample table file below. The first column contains our X‑axis data, which can be treated as categories or as values. Note that the numbers are not equally spaced, nor do they even appear in numerical order.
We will display this data on two types of chart. The first chart is an XY (Scatter) chart with X as a Value axis, and the second chart is a line chart with X as a Category axis.
Analyzing your prompt, please hold on...
An error occurred while retrieving the results. Please refresh the page and try again.