
Python के साथ प्रस्तुतियों में चार्ट लीजेंड को अनुकूलित करें
अवलोकन
Aspose.Slides for Python via .NET PowerPoint प्रस्तुतियों में चार्ट लीजेंड को अनुकूलित करने के विकल्प प्रदान करता है। यह लेख लीजेंड की स्थिति और आकार कैसे निर्धारण करें, पूरे लीजेंड के फ़ॉन्ट आकार को कैसे सेट करें, व्यक्तिगत लीजेंड प्रविष्टि को कैसे स्वरूपित करें, और चयनित प्रविष्टियों को छुपाएँ या पुनर्स्थापित करें, दिखाता है।
FAQ में सम्बंधित व्यवहारों को कवर किया गया है, जिसमें लीजेंड के लिए स्थान आरक्षित करना, बहु‑पंक्ति लेबल दिखाना, और प्रस्तुति थीम से स्वरूपण विरासत में लेना शामिल है।
लीजेंड स्थिति
लीजेंड के x, y, width, और height गुणों का उपयोग करके उसकी स्थिति और आकार को चार्ट के आयामों के अंश के रूप में निर्दिष्ट करें।
यह उदाहरण एक प्रस्तुति बनाता है और पहले स्लाइड में डिफ़ॉल्ट डेटा के साथ एक क्लस्टर्ड कॉलम चार्ट जोड़ता है। वांछित लीजेंड ऑफ़सेट और आयाम को चार्ट की चौड़ाई और ऊँचाई से विभाजित करने से वे सापेक्ष मान बन जाते हैं: लीजेंड चार्ट के बाएँ‑ऊपरी कोने से 50 पॉइंट ऑफ़सेट है और 100 × 100 पॉइंट आकार का है।
import aspose.slides as slides
import aspose.slides.charts as charts

with slides.Presentation() as presentation:
    slide = presentation.slides[0]

    chart = slide.shapes.add_chart(charts.ChartType.CLUSTERED_COLUMN, 50, 50, 500, 500)

    # चार्ट के सापेक्ष लीजेंड की स्थिति और आकार को व्यक्त करें।
    chart.legend.x = 50 / chart.width
    chart.legend.y = 50 / chart.height
    chart.legend.width = 100 / chart.width
    chart.legend.height = 100 / chart.height

    presentation.save("legend_position.pptx", slides.export.SaveFormat.PPTX)
लीजेंड का फ़ॉन्ट आकार सेट करें
लीजेंड के text_format का उपयोग करके उसके टेक्स्ट स्वरूपण तक पहुँचें और font_height को पॉइंट में सेट करें।
यह उदाहरण डिफ़ॉल्ट डेटा के साथ एक चार्ट बनाता है और लीजेंड टेक्स्ट को 20 पॉइंट पर सेट करता है। यह वर्टिकल धुरी के लिए स्वतः सीमाएँ निष्क्रिय करता है और इसकी रेंज को -5 से 10 तक सेट करता है।
import aspose.slides as slides
import aspose.slides.charts as charts

with slides.Presentation() as presentation:
    slide = presentation.slides[0]

    chart = slide.shapes.add_chart(charts.ChartType.CLUSTERED_COLUMN, 50, 50, 600, 400)

    chart.legend.text_format.portion_format.font_height = 20
    chart.axes.vertical_axis.is_automatic_min_value = False
    chart.axes.vertical_axis.min_value = -5
    chart.axes.vertical_axis.is_automatic_max_value = False
    chart.axes.vertical_axis.max_value = 10

    presentation.save("legend_font_size.pptx", slides.export.SaveFormat.PPTX)
व्यक्तिगत लीजेंड प्रविष्टि का फ़ॉन्ट आकार सेट करें
लीजेंड के entries संग्रह का उपयोग करके किसी विशिष्ट प्रविष्टि के स्वरूपण तक पहुँचें। प्रविष्टि क्रमांक शून्य‑आधारित होते हैं, इसलिए क्रमांक 1 दूसरी प्रविष्टि को दर्शाता है।
यह उदाहरण कम से कम दो श्रृंखलाओं के साथ डिफ़ॉल्ट डेटा वाला एक क्लस्टर्ड कॉलम चार्ट बनाता है। यह दूसरी लीजेंड प्रविष्टि को बोल्ड, इटैलिक और 20‑पॉइंट नीले रंग के टेक्स्ट के साथ स्वरूपित करता है।
import aspose.slides as slides
import aspose.slides.charts as charts
import aspose.pydrawing as draw

with slides.Presentation() as presentation:
    slide = presentation.slides[0]

    chart = slide.shapes.add_chart(charts.ChartType.CLUSTERED_COLUMN, 50, 50, 600, 400)

    text_format = chart.legend.entries[1].text_format
    text_format.portion_format.font_bold = slides.NullableBool.TRUE
    text_format.portion_format.font_height = 20
    text_format.portion_format.font_italic = slides.NullableBool.TRUE
    text_format.portion_format.fill_format.fill_type = slides.FillType.SOLID
    text_format.portion_format.fill_format.solid_fill_color.color = draw.Color.blue

    presentation.save("legend_entry_format.pptx", slides.export.SaveFormat.PPTX)
व्यक्तिगत लीजेंड प्रविष्टियों को छुपाएँ
एक सहायक श्रृंखला को लीजेंड से बाहर करने के लिए जबकि उसका डेटा दिखाई दे, ILegendEntryProperties.hide को True पर सेट करें, यह IChartSeries.related_legend_entry के माध्यम से किया जाता है। यह केवल चयनित लीजेंड प्रविष्टि को छुपाता है; श्रृंखला या उसके डेटा बिंदु नहीं हटते। इसके विपरीत, IChart.has_legend को False पर सेट करने से पूरी लीजेंड छुप जाती है।
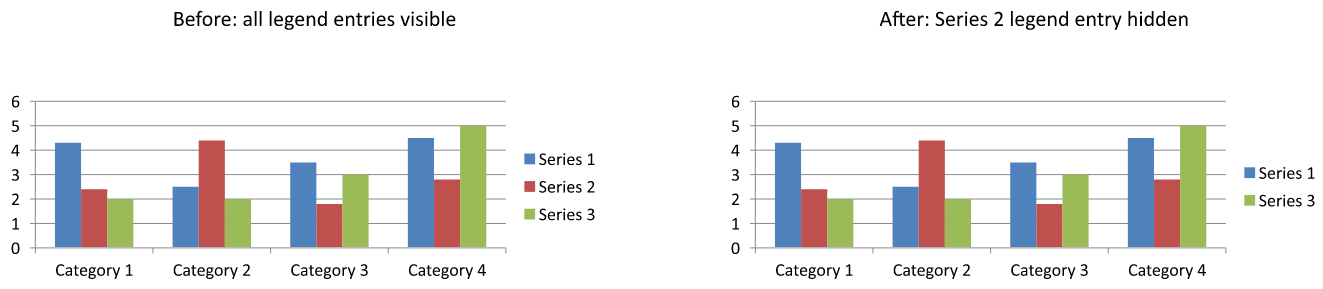
निम्न उदाहरण डिफ़ॉल्ट डेटा के साथ कई श्रृंखलाओं वाला एक क्लस्टर्ड कॉलम चार्ट बनाता है। यह दूसरी श्रृंखला की लीजेंड प्रविष्टि (क्रमांक 1) को छुपाता है और प्रस्तुति को सहेजता है। फिर यह hide को False पर सेट करके प्रविष्टि को पुनर्स्थापित करता है और दूसरा कॉपी सहेजता है। दोनों फ़ाइलों में कॉलम दिखाई देते रहते हैं।
import aspose.slides as slides
import aspose.slides.charts as charts

with slides.Presentation() as presentation:
    slide = presentation.slides[0]

    chart = slide.shapes.add_chart(charts.ChartType.CLUSTERED_COLUMN, 50, 50, 600, 400)
    chart.has_legend = True

    legend_entry = chart.chart_data.series[1].related_legend_entry
    legend_entry.hide = True

    presentation.save("hidden_legend_entry.pptx", slides.export.SaveFormat.PPTX)

    # चार्ट डेटा बदले बिना उसी प्रविष्टि को पुनर्स्थापित करें।
    legend_entry.hide = False

    presentation.save("restored_legend_entry.pptx", slides.export.SaveFormat.PPTX)
नीचे दिया गया तुलना वही चार्ट दिखाता है जिसमें सभी प्रविष्टियाँ दिखाई देती हैं और जिसमें दूसरी प्रविष्टि लीजेंड से छुपी हुई है। दूसरी श्रृंखला के कॉलम अपरिवर्तित रहते हैं।
कॉलम, बार और लाइन चार्ट में, लीजेंड प्रविष्टियाँ श्रृंखलाओं की पहचान करती हैं। पाई चार्ट में, वे व्यक्तिगत डेटा बिंदुओं (स्लाइस) की पहचान करती हैं, इसलिए चयनित स्लाइस पर IChartDataPoint.related_legend_entry का उपयोग करें। API इस डेटा‑बिंदु गुण को PIE, PIE3D, EXPLODED_PIE, EXPLODED_PIE3D, PIE_OF_PIE, और BAR_OF_PIE चार्ट प्रकारों के लिए दस्तावेज़ित करता है। डोनट चार्ट के लिए इसे मान लेना अनुशंसित नहीं है, क्योंकि वे उस सूची में शामिल नहीं हैं।
अक्सर पूछे जाने वाले प्रश्न
क्या मैं चार्ट को लीजेंड के लिए स्थान आरक्षित करने के लिए बता सकता हूँ, ताकि वह ओवरले न हो?
हां। लीजेंड को प्लॉट एरिया के ऊपर ओवरले करने की बजाए स्थान आरक्षित करने के लिए overlay को False सेट करें।
क्या मैं बहु‑पंक्ति लीजेंड लेबल बना सकता हूँ?
हां। जब उपलब्ध चौड़ाई अपर्याप्त हो तो लंबे लेबल रैप हो सकते हैं। आप श्रृंखला नामों में नई पंक्ति अक्षर सम्मिलित करके लाइन ब्रेक भी बना सकते हैं।
मैं लीजेंड को प्रस्तुति थीम की रंग योजना के अनुसार कैसे बनाऊँ?
लीजेंड के रंग, फ़िल और फ़ॉन्ट को अनसेट रखें ताकि वह थीम स्वरूपण विरासत में ले सके। स्पष्ट स्वरूपण थीम सेटिंग्स को ओवरराइड कर देगा।