
ปรับแต่งตารางข้อมูลแผนภูมิในงานนำเสนอด้วย .NET
ภาพรวม
Aspose.Slides for .NET ให้คุณแสดงตารางข้อมูลของแผนภูมิและปรับแต่งการจัดรูปแบบข้อความ, เส้นขอบ, และคีย์คำอธิบาย. บทความนี้อธิบายวิธีเปิดใช้งานตาราง, จัดรูปแบบข้อความ, ควบคุมแต่ละประเภทของเส้นขอบ, และแสดงหรือซ่อนคีย์คำอธิบาย. ตัวอย่างจะบันทึกแผนภูมิที่กำหนดค่าไว้ในไฟล์ PPTX.
ตั้งค่าคุณสมบัติฟอนต์
เพื่อแสดงตารางข้อมูลของแผนภูมิ, ตั้งค่า HasDataTable เป็น true. ใช้ ChartDataTable เพื่อเข้าถึงตารางและกำหนดการจัดรูปแบบข้อความ.
- โหลดงานนำเสนอโดยใช้คลาส Presentation.
- เพิ่มแผนภูมิคอลัมน์แบบกลุ่มลงในสไลด์แรก.
- เปิดใช้งานตารางข้อมูลของแผนภูมิ.
- เปิดใช้งานข้อความหนาโดยใช้ FontBold และตั้งค่า FontHeight เป็น
20สำหรับข้อความขนาด 20 จุด. - บันทึกงานนำเสนอที่แก้ไขแล้ว.
ตัวอย่างต่อไปนี้ต้องการไฟล์ test.pptx ในไดเรกทอรีทำงานที่มีอย่างน้อยหนึ่งสไลด์. มันจะเพิ่มแผนภูมิที่มีข้อมูลค่าเริ่มต้นที่ตำแหน่ง (50, 50) ด้วยความกว้าง 600 จุดและความสูง 400 จุด. ไฟล์ output.pptx ที่บันทึกไว้จะมีแผนภูมิที่เปิดใช้งานตารางข้อมูลและมีการใช้การตั้งค่าฟอนต์ที่ระบุ.
using Aspose.Slides;
using Aspose.Slides.Charts;
using Aspose.Slides.Export;

using var presentation = new Presentation("test.pptx");
var slide = presentation.Slides[0];

var chart = slide.Shapes.AddChart(ChartType.ClusteredColumn, 50, 50, 600, 400);
chart.HasDataTable = true;

var portionFormat = chart.ChartDataTable.TextFormat.PortionFormat;
portionFormat.FontBold = NullableBool.True;
portionFormat.FontHeight = 20;

presentation.Save("output.pptx", SaveFormat.Pptx);
ปรับแต่งเส้นขอบของตารางข้อมูล
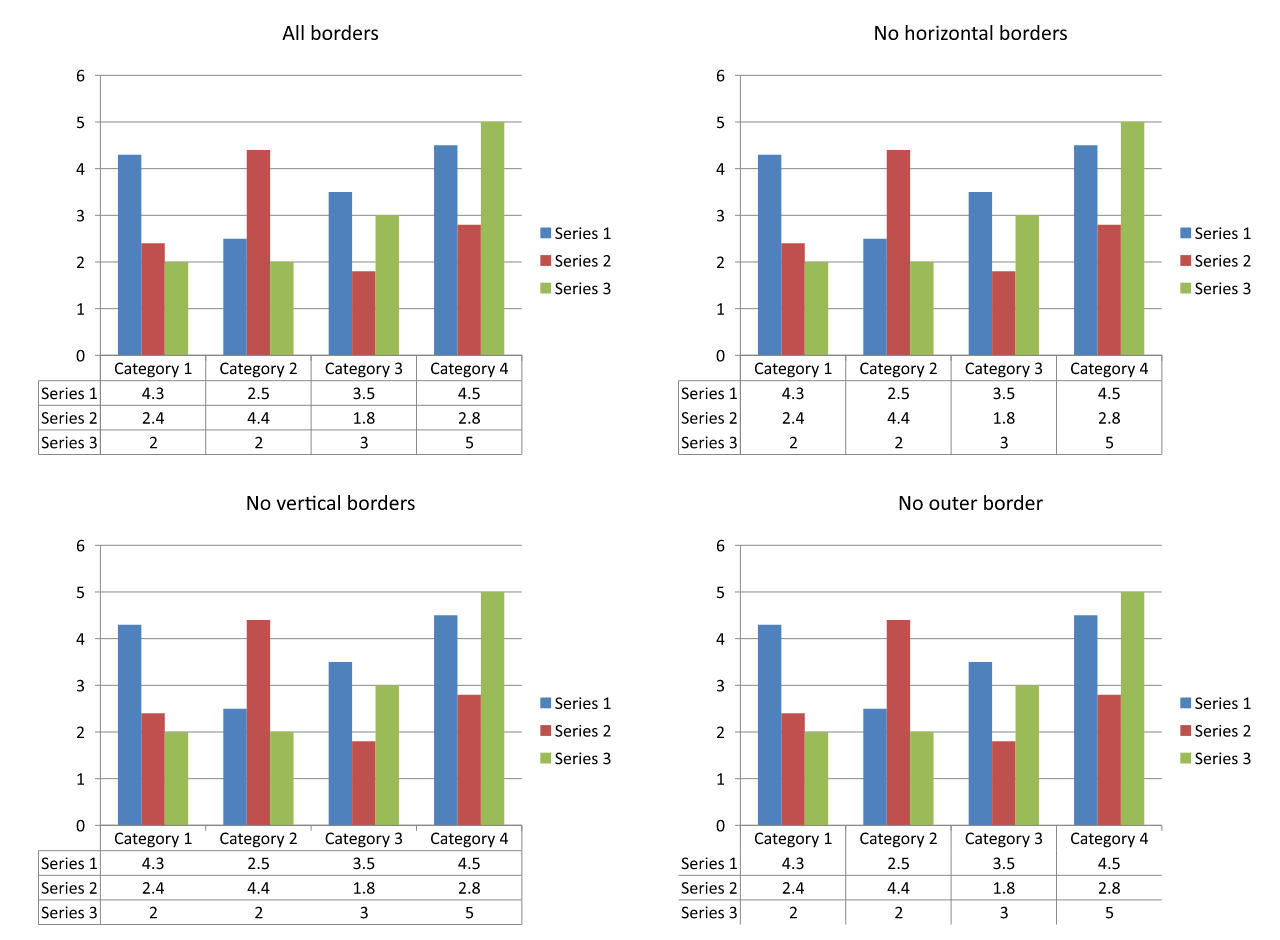
เปิดใช้งานตารางด้วย IChart.HasDataTable และเข้าถึงผ่าน IChart.ChartDataTable. คุณสามารถควบคุมเส้นขอบสามประเภทได้อย่างอิสระ:
- HasBorderHorizontal ควบคุมเส้นขอบแนวนอนของเซลล์.
- HasBorderVertical ควบคุมเส้นขอบแนวตั้งของเซลล์.
- HasBorderOutline ควบคุมเส้นขอบรอบนอกของตาราง.
ตั้งค่าคุณสมบัติแต่ละอย่างเป็น true เพื่อแสดงเส้นขอบหรือเป็น false เพื่อซ่อน. ตัวอย่างต่อไปนี้สร้างแผนภูมิคอลัมน์แบบกลุ่มที่มีข้อมูลค่าเริ่มต้น, แสดงเส้นขอบแนวนอนและเส้นขอบรอบนอก, และซ่อนเส้นขอบแนวตั้ง. ไม่จำเป็นต้องมีไฟล์อินพุต. ตำแหน่งและขนาดของแผนภูมิระบุเป็นจุด.
using Aspose.Slides;
using Aspose.Slides.Charts;
using Aspose.Slides.Export;

using var presentation = new Presentation();
var slide = presentation.Slides[0];

var chart = slide.Shapes.AddChart(ChartType.ClusteredColumn, 50, 50, 600, 400);
chart.HasDataTable = true;

var dataTable = chart.ChartDataTable;
dataTable.HasBorderHorizontal = true;
dataTable.HasBorderVertical = false;
dataTable.HasBorderOutline = true;

presentation.Save("data-table-borders.pptx", SaveFormat.Pptx);
การเปรียบเทียบด้านล่างใช้ข้อมูลแผนภูมิและการตั้งค่าคีย์คำอธิบายเดียวกันในทั้งหมดสี่กรณี. เริ่มต้นด้วยการเปิดใช้งานทุกเส้นขอบ, แต่ละตัวแปรที่เหลือปิดใช้งานเพียงหนึ่งคุณสมบัติของเส้นขอบ. ตัวแปรมุมซ้ายล่างตรงกับการตั้งค่าเส้นขอบในตัวอย่าง.
แสดงหรือซ่อนคีย์คำอธิบาย
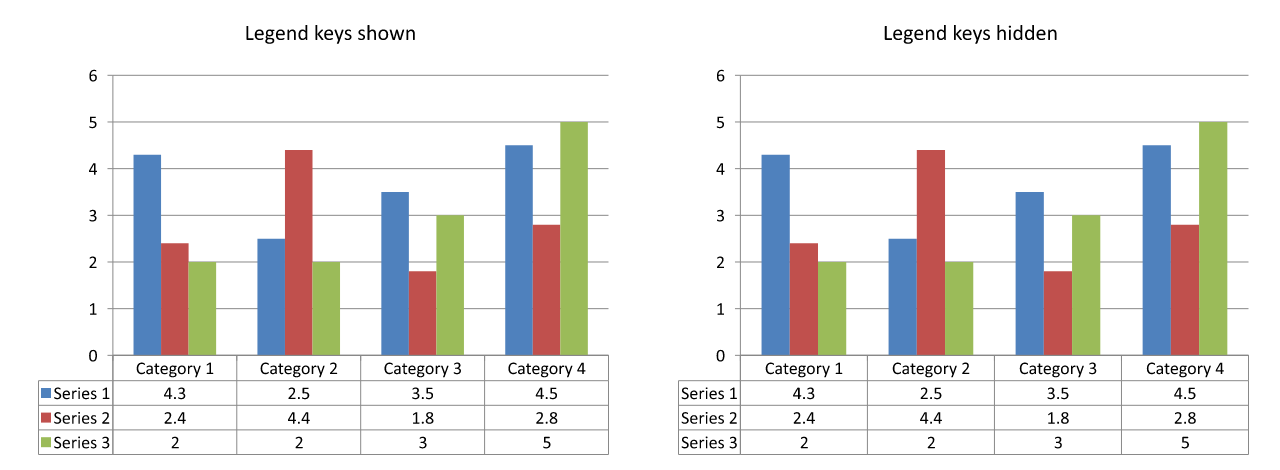
คีย์คำอธิบายเป็นเครื่องหมายสีเล็กๆ ที่อยู่ข้างชื่อชุดข้อมูลในตารางข้อมูล. พวกมันช่วยให้ผู้อ่านจับคู่แต่ละแถวของตารางกับชุดข้อมูลในแผนภูมิ. ตั้งค่า ShowLegendKey เป็น true เพื่อแสดงเครื่องหมายเหล่านี้หรือ false เพื่อซ่อน.
คำอธิบายแยกของแผนภูมิถูกควบคุมโดย IChart.HasLegend. การตั้งค่าเหล่านี้เป็นอิสระ: การซ่อนคำอธิบายแยกจะไม่ซ่อนคีย์ภายในตารางข้อมูล, และการซ่อนคีย์ในตารางจะไม่ซ่อนคำอธิบายแยก.
ตัวอย่างต่อไปนี้สร้างแผนภูมิที่มีข้อมูลค่าเริ่มต้น, เปิดใช้งานตารางข้อมูลของมัน, และแสดงคีย์คำอธิบายในตารางขณะซ่อนคำอธิบายแยก. เส้นขอบของตารางทั้งหมดถูกเปิดใช้งานอย่างชัดเจน. ไม่จำเป็นต้องมีงานนำเข้า. หากต้องการซ่อนเฉพาะคีย์ของตาราง, เปลี่ยนค่า dataTable.ShowLegendKey เป็น false.
using Aspose.Slides;
using Aspose.Slides.Charts;
using Aspose.Slides.Export;

using var presentation = new Presentation();
var slide = presentation.Slides[0];

var chart = slide.Shapes.AddChart(ChartType.ClusteredColumn, 50, 50, 600, 400);
chart.HasDataTable = true;
chart.HasLegend = false;

var dataTable = chart.ChartDataTable;
dataTable.HasBorderHorizontal = true;
dataTable.HasBorderVertical = true;
dataTable.HasBorderOutline = true;
dataTable.ShowLegendKey = true;

presentation.Save("data-table-legend-keys.pptx", SaveFormat.Pptx);
การเปรียบเทียบด้านล่างแสดงตารางเดียวกันที่เปิดและปิดคีย์คำอธิบาย. เส้นขอบทั้งหมดยังคงเปิดใช้งาน, และคำอธิบายแยกของแผนภูมิก็ถูกซ่อนในทั้งสองกรณี.
คำถามที่พบบ่อย
ฉันสามารถแสดงคีย์คำอธิบายในตารางข้อมูลของแผนภูมิได้หรือไม่?
ใช่. ตั้งค่า ShowLegendKey เป็น true เพื่อแสดงคีย์คำอธิบายหรือเป็น false เพื่อซ่อน.
ตารางข้อมูลจะยังคงอยู่เมื่อส่งออกงานนำเสนเป็น PDF, HTML หรือรูปภาพหรือไม่?
ใช่. Aspose.Slides จะเรนเดอร์แผนภูมิและตารางข้อมูลที่แสดงเป็นส่วนหนึ่งของสไลด์เมื่อส่งออกเป็น PDF, HTML, หรือ images.
ฉันสามารถทำงานกับตารางข้อมูลในแผนภูมิที่โหลดจากเทมเพลตได้หรือไม่?
ใช่. สำหรับแผนภูมิที่โหลดจากงานนำเสนอหรือเทมเพลตที่มีอยู่, ให้ใช้ HasDataTable เพื่อเช็คหรือตั้งค่าว่าตารางข้อมูลของมันจะแสดงหรือไม่.
ฉันจะค้นหาแผนภูมิที่เปิดใช้งานตารางข้อมูลได้อย่างไร?
ทำการวนซ้ำผ่านรูปร่างทั้งหมดในแต่ละสไลด์, ระบุแผนภูมิ, และตรวจสอบคุณสมบัติ HasDataTable ของพวกมัน. ค่า true แสดงว่าตารางข้อมูลเปิดใช้งาน.