
使用 Python 管理簡報中的圖表工作簿
概述
本文章說明如何在 Aspose.Slides 中使用圖表工作簿。它示範如何透過工作簿串流讀寫圖表資料、將工作簿儲存格作為圖表資料標籤、存取工作表集合,以及為圖表值指定資料來源類型。
同時也涵蓋使用外部工作簿作為圖表資料來源的情況。範例示範如何建立並指派外部工作簿、取得連結至圖表的外部工作簿路徑,以及在工作簿可用時編輯圖表資料。
對於代表缺失資料的工作簿儲存格,請參閱控制空儲存格的顯示以了解空儲存格與零的差異,以及可用顯示模式的折線圖比較。
包含隱藏列與欄的資料
使用Chart.plot_visible_cells_only控制圖表是否僅繪製可見工作表列與欄的資料。設定為 True 只繪製可見儲存格,設定為 False 則同時包含可見與隱藏儲存格。此設定僅影響圖表繪製;不會隱藏或取消隱藏工作表列或欄。
樣本簡報的第一張投影片第一個圖形是一個直條圖。內嵌工作表 Sheet1 包含來源範圍 A1:C4。第 3 列與 C 欄被隱藏,但其儲存格仍含有值。
| 工作表列 | A: 月份 | B: 零售 | C: 批發(隱藏欄) |
|---|---|---|---|
| 2 | 一月 | 10 | 30 |
| 3(隱藏列) | 二月 | 40 | 60 |
| 4 | 三月 | 20 | 50 |
透過ChartData.chart_data_workbook存取來源儲存格,並讀取ChartDataCell.is_hidden檢查其隱藏狀態。此屬性唯讀。在此檔案中,B2 為可見,B3 屬於隱藏列,C2 屬於隱藏欄;範例分別印出 False、True、True。
對於本範例,在變更繪圖設定後請重新整理圖表資料:使用read_workbook_stream保留內嵌工作簿,並以write_workbook_stream重新載入。若要包含所有儲存格,亦需使用set_range恢復完整範圍,包含隱藏的二月類別。僅變更旗標不足以重新整理此範例的快取圖表資料與類別標籤。
import aspose.slides as slides
import aspose.slides.charts as charts

with slides.Presentation("hidden-source-data.pptx") as presentation:
    slide = presentation.slides[0]

    if len(slide.shapes) > 0 and isinstance(slide.shapes[0], charts.Chart):
        chart = slide.shapes[0]
        workbook = chart.chart_data.chart_data_workbook
        print(f"B2 hidden: {workbook.get_cell(0, 'B2').is_hidden}")
        print(f"B3 hidden: {workbook.get_cell(0, 'B3').is_hidden}")
        print(f"C2 hidden: {workbook.get_cell(0, 'C2').is_hidden}")

        workbook_stream = chart.chart_data.read_workbook_stream()
        for visible_only in [True, False]:
            chart.plot_visible_cells_only = visible_only

            # 從嵌入的工作簿重新整理圖表資料。
            workbook_stream.seek(0)
            chart.chart_data.write_workbook_stream(workbook_stream)
            if not visible_only:
                # 恢復完整的來源範圍,包括隱藏的類別。
                chart.chart_data.set_range("Sheet1!$A$1:$C$4")

            presentation.save(f"hidden_cells_{visible_only}.pptx", slides.export.SaveFormat.PPTX)
    else:
        print("The first shape is not a chart.")
範例會儲存兩個版本的簡報:一個僅包含可見的零售值 (10 與 20),另一個則包含全部六個值。下方圖片是重新開啟儲存後的簡報渲染結果;兩個檔案皆保留其繪圖設定。第 3 列與 C 欄在兩個內嵌工作簿中仍保持隱藏。
僅顯示儲存格 (True) |
所有儲存格 (False) |
|---|---|
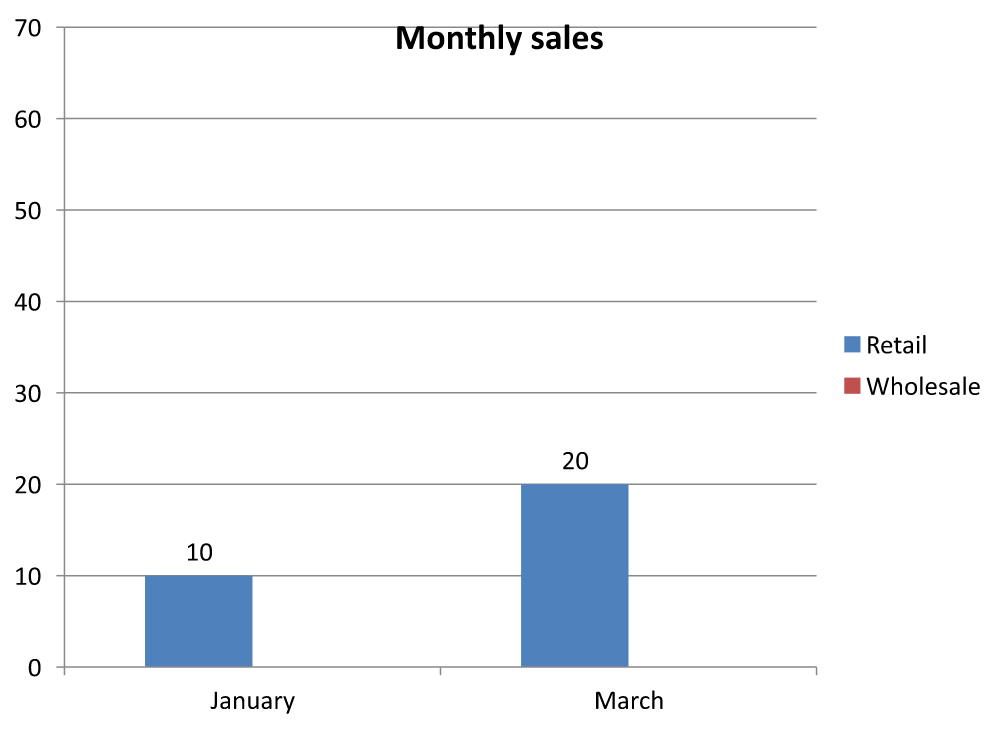 |
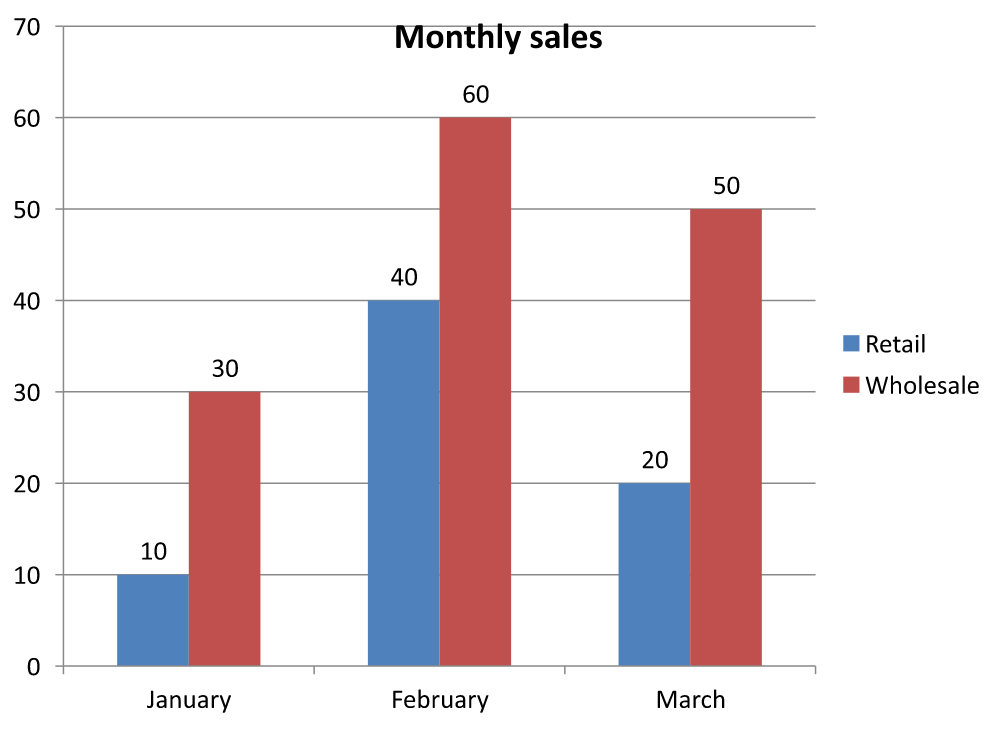 |
含值的隱藏儲存格不同於空儲存格。Chart.display_blanks_as 控制缺失值的顯示方式;它不會包含或排除隱藏的來源資料。請參閱控制空儲存格的顯示取得範例說明。
取得圖表的資料範圍
在更新現有簡報中的工作簿資料之前,先檢查來源範圍以辨識每個圖表使用的工作表儲存格。ChartData.get_range 方法會回傳目前資料範圍的工作表限定公式,例如 Sheet1!$A$1:$D$5。此處 Sheet1 為工作表名稱,! 用於分隔工作表名稱與儲存格範圍,$A$1:$D$5 表示 A1 到 D5(含)之間的儲存格,美元符號表示絕對列與欄參照。
此方法只讀取目前範圍,不會變更圖表或其工作簿。若圖表未使用工作簿作為資料來源,會拋出例外。更多資訊請參閱ChartData API 參考文件。
此範例會開啟簡報並直接檢查每張投影片上的圖形是否為圖表,印出每個圖表的名稱與來源範圍。若無法取得範圍,會印出診斷訊息並繼續處理下一個圖表。
import aspose.slides as slides
import aspose.slides.charts as charts

with slides.Presentation("presentation.pptx") as presentation:
    for slide in presentation.slides:
        for shape in slide.shapes:
            if isinstance(shape, charts.Chart):
                try:
                    data_range = shape.chart_data.get_range()
                    print(f"{shape.name}: {data_range}")
                except RuntimeError as error:
                    print(f"{shape.name}: Unable to retrieve the chart data range. {error}")
從工作簿讀寫圖表資料
Aspose.Slides for Python via .NET 提供 read_workbook_stream 與 write_workbook_stream 方法,讓您讀寫圖表資料工作簿(包含使用 Aspose.Cells 編輯的圖表資料)。注意 圖表資料必須以相同方式組織,或至少結構類似於來源。
此範例使用第一張投影片第一個圖形的圖表。它會將內嵌工作簿讀入串流,清除現有的系列與類別,然後將相同的工作簿寫回。變更僅保留在記憶體中,範例不會儲存簡報。
import aspose.slides as slides
import aspose.slides.charts as charts

with slides.Presentation("chart.pptx") as presentation:
    slide = presentation.slides[0]

    if len(slide.shapes) > 0 and isinstance(slide.shapes[0], charts.Chart):
        chart = slide.shapes[0]
        chart_data = chart.chart_data
        workbook_stream = chart_data.read_workbook_stream()

        chart_data.series.clear()
        chart_data.categories.clear()

        workbook_stream.seek(0)
        chart_data.write_workbook_stream(workbook_stream)
    else:
        print("The first shape is not a chart.")
在工作簿修改後驗證圖表版面配置
當您以已修改的工作簿取代內嵌工作簿時,圖表仍保留原始的系列與類別集合。此不匹配可能導致Chart.validate_chart_layout 因索引超出範圍而失敗。請在寫回更新後的工作簿之前先清除現有的系列與類別。此範例使用第一張投影片第一個圖形的圖表。註解標示了工作簿編輯可能發生的地方;可執行範例會寫回原始工作簿並在記憶體中驗證版面配置。
import aspose.slides as slides
import aspose.slides.charts as charts

with slides.Presentation("chart.pptx") as presentation:
    slide = presentation.slides[0]

    if len(slide.shapes) > 0 and isinstance(slide.shapes[0], charts.Chart):
        chart = slide.shapes[0]
        chart_data = chart.chart_data
        workbook_stream = chart_data.read_workbook_stream()

        # 在此修改工作簿串流,例如使用 Aspose.Cells。

        chart_data.series.clear()
        chart_data.categories.clear()

        workbook_stream.seek(0)
        chart_data.write_workbook_stream(workbook_stream)
        chart.validate_chart_layout()
    else:
        print("The first shape is not a chart.")
清除集合可在工作簿寫回前移除過期的資料參考。於寫回圖表前,請依需要重新建立系列與類別的對應關係。
將工作簿儲存格設為圖表資料標籤
您可以使用工作簿儲存格中的文字作為圖表資料標籤。
此範例在現有簡報的第一張投影片新增一個預設資料的氣泡圖,使用工作表 0 的儲存格 A10:A12 作為第一系列的前三個標籤,啟用儲存格來源的標籤,並儲存更新後的簡報。
import aspose.slides as slides
import aspose.slides.charts as charts

with slides.Presentation("chart2.pptx") as presentation:
    slide = presentation.slides[0]

    chart = slide.shapes.add_chart(charts.ChartType.BUBBLE, 50, 50, 600, 400, True)
    series = chart.chart_data.series[0]
    workbook = chart.chart_data.chart_data_workbook

    series.labels.default_data_label_format.show_label_value_from_cell = True
    series.labels[0].value_from_cell = workbook.get_cell(0, "A10", "Label 0 cell value")
    series.labels[1].value_from_cell = workbook.get_cell(0, "A11", "Label 1 cell value")
    series.labels[2].value_from_cell = workbook.get_cell(0, "A12", "Label 2 cell value")

    presentation.save("resultchart.pptx", slides.export.SaveFormat.PPTX)
管理工作表
ChartDataWorkbook.worksheets 屬性提供對圖表工作簿中工作表的存取。此範例建立一個預設資料的圓餅圖,並將每個工作表名稱印至主控台。
import aspose.slides as slides
import aspose.slides.charts as charts

with slides.Presentation() as presentation:
    slide = presentation.slides[0]

    chart = slide.shapes.add_chart(charts.ChartType.PIE, 50, 50, 400, 500)
    workbook = chart.chart_data.chart_data_workbook

    for worksheet in workbook.worksheets:
        print(worksheet.name)
指定資料來源類型
此範例建立一個 3D 直條圖,使用預設資料並以不同的資料來源設定兩個系列名稱。第一個名稱使用字串常值;第二個名稱使用工作表 0 的儲存格 C1。DataSourceType 列舉選擇每個名稱的來源。範例會儲存簡報,讓系列名稱已更新。
import aspose.slides as slides
import aspose.slides.charts as charts

with slides.Presentation() as presentation:
    slide = presentation.slides[0]

    chart = slide.shapes.add_chart(charts.ChartType.COLUMN_3D, 50, 50, 600, 400, True)
    literal_name = chart.chart_data.series[0].name

    literal_name.data_source_type = charts.DataSourceType.STRING_LITERALS
    literal_name.data = "LiteralString"

    cell_name = chart.chart_data.series[1].name
    name_cell = chart.chart_data.chart_data_workbook.get_cell(0, "C1", "NewCell")
    cell_name.data_source_type = charts.DataSourceType.WORKSHEET
    cell_name.data = name_cell

    presentation.save("pres.pptx", slides.export.SaveFormat.PPTX)
偵測不支援的嵌入式工作簿格式
Aspose.Slides 不支援可嵌入於某些圖表的 Excel 二進位工作簿 (.xlsb) 格式。您可以在 ChartData 上使用 embedded_workbook_type 屬性,搭配 WorkbookType 列舉,來偵測不支援的格式並跳過那些圖表。此範例會檢查現有簡報第一張投影片上的圖形,跳過非圖表圖形,並對每個含有嵌入 .xlsb 工作簿的圖表印出診斷訊息。
import aspose.slides as slides
import aspose.slides.charts as charts

with slides.Presentation("sample.pptx") as presentation:
    slide = presentation.slides[0]

    for shape in slide.shapes:
        if not isinstance(shape, charts.Chart):
            continue

        chart_data = shape.chart_data
        is_internal_workbook = chart_data.data_source_type == charts.ChartDataSourceType.INTERNAL_WORKBOOK
        is_binary_macro = chart_data.embedded_workbook_type == charts.WorkbookType.WORKBOOK_BINARY_MACRO

        if is_internal_workbook and is_binary_macro:
            print("Skipping a chart with an unsupported .xlsb workbook.")
            continue

        # 在此讀取或修改支援的圖表工作簿資料。
外部工作簿
Aspose.Slides 支援使用外部工作簿作為圖表的資料來源。
建立外部工作簿
使用 read_workbook_stream 與 set_external_workbook 將內嵌圖表工作簿匯出為檔案,並將圖表連結至該外部工作簿。
此範例建立一個預設資料的圓餅圖,將其工作簿匯出。關閉輸出串流後指派外部工作簿作為圖表資料來源,最後儲存已連結的簡報。
from pathlib import Path
import aspose.slides as slides
import aspose.slides.charts as charts

with slides.Presentation() as presentation:
    slide = presentation.slides[0]

    chart = slide.shapes.add_chart(charts.ChartType.PIE, 50, 50, 400, 600)
    workbook_path = str(Path("externalWorkbook1.xlsx").resolve())

    workbook_stream = chart.chart_data.read_workbook_stream()
    workbook_data = workbook_stream.read()
    with open(workbook_path, "wb") as file_stream:
        file_stream.write(workbook_data)

    chart.chart_data.set_external_workbook(workbook_path)

    presentation.save("externalWorkbook.pptx", slides.export.SaveFormat.PPTX)
設定外部工作簿
使用 set_external_workbook 方法,您可以將外部工作簿指派給圖表作為資料來源。此方法亦可用於更新外部工作簿的路徑(若該檔案已搬移)。
雖然無法直接編輯儲存於遠端位置或資源的工作簿資料,但仍可將此類工作簿作為外部資料來源。若提供相對路徑,系統會自動轉換為完整路徑。
此範例使用一個外部工作簿,其工作表 Sheet1 包含 B1 的系列名稱、A2:A4 的類別名稱以及 B2:B4 的數值。範例建立一個圓餅圖、連結工作簿,並使用 set_range 將 A1:B4 對映至一個系列與三個類別。最後儲存已連結圖表的簡報。
from pathlib import Path
import aspose.slides as slides
import aspose.slides.charts as charts

with slides.Presentation() as presentation:
    slide = presentation.slides[0]

    chart = slide.shapes.add_chart(charts.ChartType.PIE, 50, 50, 400, 600, True)
    chart_data = chart.chart_data
    workbook_path = str(Path("externalWorkbook.xlsx").resolve())

    chart_data.set_external_workbook(workbook_path)
    chart_data.set_range("Sheet1!$A$1:$B$4")

    presentation.save("Presentation_with_externalWorkbook.pptx", slides.export.SaveFormat.PPTX)
set_external_workbook 的 update_chart_data 參數決定是否載入工作簿。
- 當
update_chart_data為False時,僅更新工作簿路徑。圖表資料不會從目標工作簿載入或更新,因而工作簿可以不存在。 - 當
update_chart_data為True時,圖表資料會自目標工作簿更新。
以下範例將佔位 URL 指派給 update_chart_data=False。它保留圓餅圖的預設資料,且在未載入不可用的工作簿情況下儲存簡報。
import aspose.slides as slides
import aspose.slides.charts as charts

with slides.Presentation() as presentation:
    slide = presentation.slides[0]

    chart = slide.shapes.add_chart(charts.ChartType.PIE, 50, 50, 400, 600, True)
    chart.chart_data.set_external_workbook("https://example.com/unavailable-workbook.xlsx", False)

    presentation.save("SetExternalWorkbookWithUpdateChartData.pptx", slides.export.SaveFormat.PPTX)
取得圖表的外部資料來源工作簿路徑
若要辨識連結至圖表的工作簿,請檢查圖表是否使用外部資料來源,並取得其工作簿路徑。
此範例檢查簡報第一張投影片第一個圖形是否為連結至外部工作簿的圖表。若是,會將 external_workbook_path 印至主控台,然後儲存簡報的副本。
import aspose.slides as slides
import aspose.slides.charts as charts

with slides.Presentation("externalWorkbook.pptx") as presentation:
    slide = presentation.slides[0]

    if len(slide.shapes) > 0 and isinstance(slide.shapes[0], charts.Chart):
        chart = slide.shapes[0]
        chart_data = chart.chart_data
        if chart_data.data_source_type == charts.ChartDataSourceType.EXTERNAL_WORKBOOK:
            print(chart_data.external_workbook_path)
        else:
            print("The chart does not use an external workbook.")
    else:
        print("The first shape is not a chart.")

    presentation.save("Result.pptx", slides.export.SaveFormat.PPTX)
編輯圖表資料
您可以以與編輯內部工作簿相同的方式編輯外部工作簿的資料。若無法載入外部工作簿,將拋出例外。
此範例使用第一張投影片第一個圖形且已連結可存取的外部工作簿的圖表。它將第一系列第一資料點的儲存格支援值設為 100,並儲存更新後的簡報。編輯儲存格值會更新連結的外部 XLSX 檔案,若需保留原始工作簿,請使用其副本。
import aspose.slides as slides
import aspose.slides.charts as charts

with slides.Presentation("presentation.pptx") as presentation:
    slide = presentation.slides[0]

    if len(slide.shapes) > 0 and isinstance(slide.shapes[0], charts.Chart):
        chart = slide.shapes[0]
        series = chart.chart_data.series
        if len(series) > 0 and len(series[0].data_points) > 0:
            value_cell = series[0].data_points[0].value.as_cell
            if value_cell is not None:
                value_cell.value = 100
                presentation.save("presentation_out.pptx", slides.export.SaveFormat.PPTX)
            else:
                print("The first data point is not linked to a workbook cell.")
        else:
            print("The chart has no data points to edit.")
    else:
        print("The first shape is not a chart.")
從圖表快取復原工作簿
如果圖表使用的外部工作簿遺失或不可用,Aspose.Slides 可以從簡報中的快取資料重建圖表工作簿。請建立 LoadOptions,設定其 spreadsheet_options,並將 SpreadsheetOptions.recover_workbook_from_chart_cache 設為 True 後再開啟簡報。
以下 Python 範例會為第一張投影片第一個圖形、且參考不可用外部工作簿的圖表復原工作簿資料,並透過 Chart.chart_data 與 ChartData.chart_data_workbook 取得復原後的資料:
import aspose.slides as slides
import aspose.slides.charts as charts

load_options = slides.LoadOptions()
load_options.spreadsheet_options.recover_workbook_from_chart_cache = True

with slides.Presentation("presentation.pptx", load_options) as presentation:
    slide = presentation.slides[0]

    if len(slide.shapes) > 0 and isinstance(slide.shapes[0], charts.Chart):
        chart = slide.shapes[0]
        recovered_workbook = chart.chart_data.chart_data_workbook

        # 在此讀取或修改已復原的工作簿資料。
    else:
        print("The first shape is not a chart.")
若外部工作簿不可用且未啟用復原,Aspose.Slides 會拋出例外。僅在使用快取圖表資料作為可接受的備援時才啟用復原,因為快取可能不包含外部工作簿在簡報最後更新後所做的變更。
常見問題
我能否判斷特定圖表是連結至外部工作簿還是內嵌工作簿?
可以。圖表具有資料來源類型與外部工作簿路徑,若來源為外部工作簿,您即可讀取完整路徑以確認使用的是外部檔案。
是否支援相對路徑的外部工作簿,且它們如何儲存?
支援。若您指定相對路徑,系統會自動轉換為絕對路徑。簡報會在 PPTX 檔案中儲存絕對路徑,搬移工作簿可能需要更新連結。
我能使用位於網路資源/分享上的工作簿嗎?
可以,這類工作簿可作為外部資料來源。但 Aspose.Slides 不支援直接編輯遠端工作簿——它們只能作為來源使用。
Aspose.Slides 在儲存簡報時會覆寫外部 XLSX 嗎?
簡報只會儲存指向外部檔案的連結。編輯儲存格支援的圖表資料也可能會更新連結的本機 XLSX 檔案。若原始工作簿必須保持不變,請使用其副本。
如果外部檔案受密碼保護,我該怎麼做?
Aspose.Slides 連結時不接受密碼。常見做法是事先移除保護,或使用例如 Aspose.Cells 產生已解密的副本,再連結至該副本。
多個圖表能共用同一個外部工作簿嗎?
可以。每個圖表會儲存自己的連結。若它們皆指向同一檔案,更新該檔案後,下一次載入資料時每個圖表皆會反映變更。