
使用 Python 在簡報中管理圖表資料標籤
簡介
資料標籤會顯示圖表系列與個別資料點的資訊,協助讀者辨識數值並了解圖表。本篇說明如何格式化數值、顯示百分比、讀取標籤文字、控制超出座標軸最大值的標籤、調整類別座標軸標籤間距,以及設定圓餅圖標籤的位置。
設定圖表資料標籤的資料精度
使用number_format_of_values 來格式化系列值。此範例建立一個具有預設資料的折線圖,顯示其資料表,並為第一個系列啟用值標籤。格式 #,##0.00 會顯示千位分隔符號與兩位小數,且不會更改底層的值。
import aspose.slides as slides
import aspose.slides.charts as charts

with slides.Presentation() as presentation:
    slide = presentation.slides[0]

    chart = slide.shapes.add_chart(charts.ChartType.LINE, 50, 50, 450, 300)
    chart.has_data_table = True

    series = chart.chart_data.series[0]
    series.number_format_of_values = "#,##0.00"
    series.labels.default_data_label_format.show_value = True

    presentation.save("PrecisionOfDatalabels_out.pptx", slides.export.SaveFormat.PPTX)
顯示百分比為標籤
對於堆疊直條圖,先將每個值計算為其類別總和的百分比,然後將文字指派給text_frame_for_overriding。此範例使用預設圖表資料,並以 8 點字型顯示保留兩位小數的百分比。總和為零的類別會被跳過,以避免除以零。若圖表資料變更,需重新計算自訂標籤文字。
import aspose.slides as slides
import aspose.slides.charts as charts

with slides.Presentation() as presentation:
    slide = presentation.slides[0]

    chart = slide.shapes.add_chart(charts.ChartType.STACKED_COLUMN, 20, 20, 400, 400)

    category_totals = [0.0] * len(chart.chart_data.categories)
    for k in range(len(chart.chart_data.categories)):
        for series in chart.chart_data.series:
            point_value = float(series.data_points[k].value.data)
            category_totals[k] += point_value

    for series in chart.chart_data.series:
        series.labels.default_data_label_format.show_legend_key = False

        for j in range(len(series.data_points)):
            label = series.data_points[j].label
            if category_totals[j] == 0:
                continue

            point_value = float(series.data_points[j].value.data)
            data_point_percent = point_value / category_totals[j] * 100

            portion = slides.Portion()
            portion.text = f"{data_point_percent:.2f} %"
            portion.portion_format.font_height = 8

            label.text_frame_for_overriding.text = ""

            paragraph = label.text_frame_for_overriding.paragraphs[0]
            paragraph.portions.add(portion)

            label.data_label_format.show_value = True
            label.data_label_format.show_series_name = False
            label.data_label_format.show_percentage = False
            label.data_label_format.show_legend_key = False
            label.data_label_format.show_category_name = False
            label.data_label_format.show_bubble_size = False

    presentation.save("DisplayPercentageAsLabels_out.pptx", slides.export.SaveFormat.PPTX)
設定圖表資料標籤的百分比符號
當值以分數形式儲存時,使用number_format 以顯示百分比。將is_number_format_linked_to_source 設為 False,即可使標籤格式獨立於來源儲存格。
此範例建立一個 100% 堆疊直條圖,四個類別中包含紅色與藍色系列。每對值的總和為 1。標籤格式 0.0% 會將 0.30 顯示為 30.0%,而垂直座標軸則使用兩位小數。兩個系列的標籤文字皆為白色、10 點。
import aspose.slides as slides
import aspose.slides.charts as charts
import aspose.pydrawing as drawing

with slides.Presentation() as presentation:
    slide = presentation.slides[0]

    chart = slide.shapes.add_chart(charts.ChartType.PERCENTS_STACKED_COLUMN, 20, 20, 500, 400)

    chart.axes.vertical_axis.is_number_format_linked_to_source = False
    chart.axes.vertical_axis.number_format = "0.00%"

    chart.chart_data.series.clear()
    chart.chart_data.categories.clear()

    workbook = chart.chart_data.chart_data_workbook
    worksheet_index = 0
    for i in range(4):
        category_cell = workbook.get_cell(worksheet_index, i + 1, 0, f"Category {i + 1}")
        chart.chart_data.categories.add(category_cell)

    series_names = ["Reds", "Blues"]
    series_colors = [drawing.Color.red, drawing.Color.blue]
    values = [[0.30, 0.50, 0.80, 0.65], [0.70, 0.50, 0.20, 0.35]]

    for i in range(len(series_names)):
        series_cell = workbook.get_cell(worksheet_index, 0, i + 1, series_names[i])
        series = chart.chart_data.series.add(series_cell, chart.type)
        for j in range(4):
            value_cell = workbook.get_cell(worksheet_index, j + 1, i + 1, values[i][j])
            series.data_points.add_data_point_for_bar_series(value_cell)

        series.format.fill.fill_type = slides.FillType.SOLID
        series.format.fill.solid_fill_color.color = series_colors[i]

        label_format = series.labels.default_data_label_format
        label_format.show_value = True
        label_format.is_number_format_linked_to_source = False
        label_format.number_format = "0.0%"
        label_format.text_format.portion_format.font_height = 10
        label_format.text_format.portion_format.fill_format.fill_type = slides.FillType.SOLID
        label_format.text_format.portion_format.fill_format.solid_fill_color.color = drawing.Color.white

    presentation.save("SetDataLabelsPercentageSign_out.pptx", slides.export.SaveFormat.PPTX)
讀取資料標籤的實際文字
使用get_actual_label_text 來取得資料標籤設定產生的文字。當需將標籤匯出為報告、搜尋簡報內容或驗證產生的圖表時,此功能相當有用。在下方範例中,預設的data label format 會結合每個類別名稱、系列名稱與數值。某一資料點將其數值格式化為百分比,另一資料點則使用text_frame_for_overriding 的自訂文字。
import aspose.slides as slides
import aspose.slides.charts as charts

with slides.Presentation() as presentation:
    slide = presentation.slides[0]

    chart = slide.shapes.add_chart(charts.ChartType.CLUSTERED_COLUMN, 20, 20, 500, 300)

    chart.chart_data.series.clear()
    chart.chart_data.categories.clear()

    workbook = chart.chart_data.chart_data_workbook
    for i, category_name in enumerate(["Q1", "Q2"]):
        category_cell = workbook.get_cell(0, i + 1, 0, category_name)
        chart.chart_data.categories.add(category_cell)

    north_cell = workbook.get_cell(0, 0, 1, "North")
    north = chart.chart_data.series.add(north_cell, chart.type)
    for i, value in enumerate([0.25, 0.75]):
        value_cell = workbook.get_cell(0, i + 1, 1, value)
        north.data_points.add_data_point_for_bar_series(value_cell)

    south_cell = workbook.get_cell(0, 0, 2, "South")
    south = chart.chart_data.series.add(south_cell, chart.type)
    for i, value in enumerate([0.40, 0.60]):
        value_cell = workbook.get_cell(0, i + 1, 2, value)
        south.data_points.add_data_point_for_bar_series(value_cell)

    for series in chart.chart_data.series:
        label_format = series.labels.default_data_label_format
        label_format.show_category_name = True
        label_format.show_series_name = True
        label_format.show_value = True

    north.labels[1].data_label_format.is_number_format_linked_to_source = False
    north.labels[1].data_label_format.number_format = "0%"
    south.labels[0].text_frame_for_overriding.text = "Reviewed"

    for series in chart.chart_data.series:
        for point in series.data_points:
            label = point.label
            if not label.is_visible:
                continue

            label_text = label.get_actual_label_text()
            print(f"Value: {point.value.data}; label: {label_text}")
資料點中儲存的數值仍為 0.75,即使其標籤顯示為 75% 並附加類別與系列名稱。自訂文字會取代產生的標籤文字。get_actual_label_text 會在兩種情況下皆回傳最終的標籤字串。若只想抽取可見的標籤,請如上所示另行檢查is_visible。
控制超出座標軸最大值的資料標籤
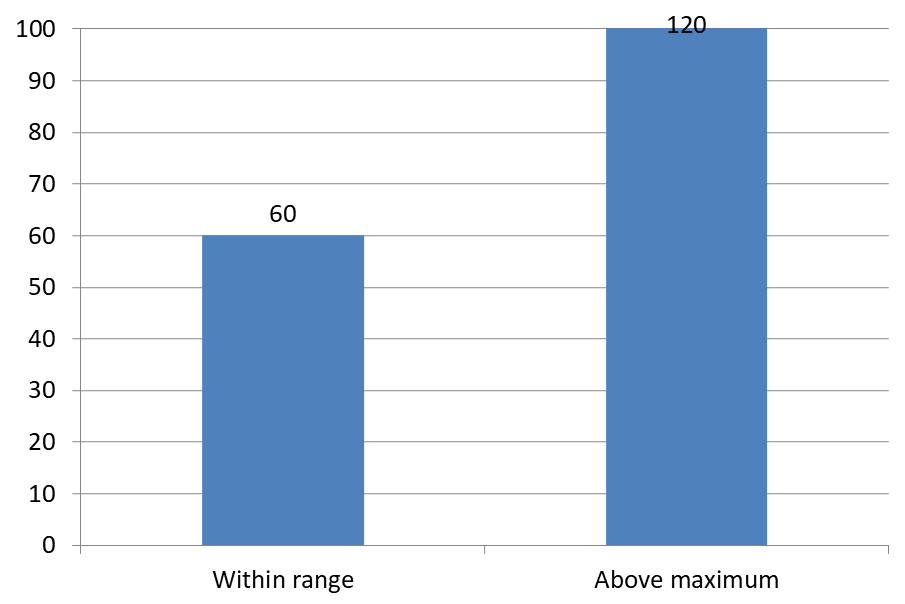
當手動限制座標軸範圍時,可能會有資料點超過其最大值。使用show_data_labels_over_maximum 來控制是否顯示其資料標籤。此設定僅會改變標籤的可見性,並不會更改座標軸範圍或底層資料值。
以下範例建立一個 2D 群組直條圖,資料值為 60 與 120。於垂直座標軸上將is_automatic_max_value 設為 False,並將max_value 設為 100。第一張投影片允許標籤超出最大值;其副本則將其停用。兩張投影片皆儲存為 DataLabelsOverMaximum.pptx。
使用show_value 來啟用值標籤。圖表層級的設定本身不會自動顯示值,也不會覆寫個別標籤已停用的值顯示。此範例為整個系列啟用值,並使用position 將標籤放置於每個直條的外側端點。
import aspose.slides as slides
import aspose.slides.charts as charts

with slides.Presentation() as presentation:
    slide = presentation.slides[0]

    chart = slide.shapes.add_chart(charts.ChartType.CLUSTERED_COLUMN, 50, 50, 600, 400)
    chart.has_legend = False

    chart.chart_data.series.clear()
    chart.chart_data.categories.clear()

    workbook = chart.chart_data.chart_data_workbook

    first_category = workbook.get_cell(0, 1, 0, "Within range")
    second_category = workbook.get_cell(0, 2, 0, "Above maximum")

    chart.chart_data.categories.add(first_category)
    chart.chart_data.categories.add(second_category)

    series_name = workbook.get_cell(0, 0, 1, "Values")
    series = chart.chart_data.series.add(series_name, chart.type)

    first_value = workbook.get_cell(0, 1, 1, 60)
    second_value = workbook.get_cell(0, 2, 1, 120)

    series.data_points.add_data_point_for_bar_series(first_value)
    series.data_points.add_data_point_for_bar_series(second_value)

    series.labels.default_data_label_format.show_value = True
    series.labels.default_data_label_format.position = charts.LegendDataLabelPosition.OUTSIDE_END

    chart.axes.vertical_axis.is_automatic_max_value = False
    chart.axes.vertical_axis.max_value = 100
    chart.show_data_labels_over_maximum = True

    second_slide = presentation.slides.add_clone(slide)
    second_chart = second_slide.shapes[0]
    second_chart.show_data_labels_over_maximum = False

    presentation.save("DataLabelsOverMaximum.pptx", slides.export.SaveFormat.PPTX)
以下圖片顯示 Microsoft PowerPoint 呈現的已儲存投影片。當設定為 True 時,標籤 120 會出現在上邊界;設定為 False 時則會隱藏。標籤 60 仍保持可見,座標軸最大值維持 100,且第二個資料點在兩種情況下皆為 120。
| show_data_labels_over_maximum = True | show_data_labels_over_maximum = False |
|---|---|
 |
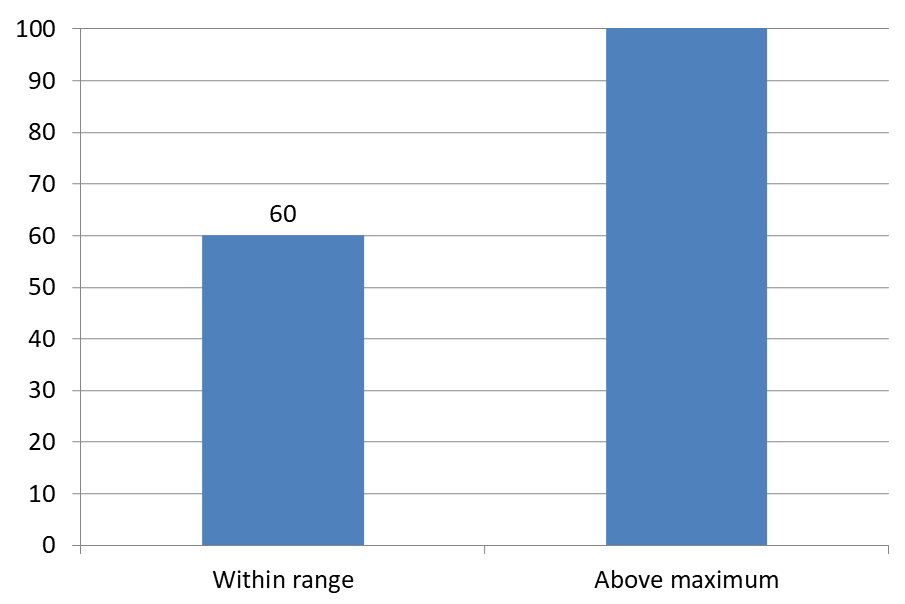 |
Chart Type
此範例使用具有值座標軸的 2D 直條圖。沒有值座標軸的圖表(例如圓餅圖與環形圖)無法以此方式限制座標軸最大值。設定標籤與座標軸的距離
使用label_offset 來控制類別座標軸標籤與座標軸之間的距離。此數值為座標軸標籤最大字型大小的百分比。此範例建立一個群組直條圖,並將水平座標軸標籤偏移設定為 500。此設定影響類別座標軸的標籤,而非附加於個別資料點的標籤。
import aspose.slides as slides
import aspose.slides.charts as charts

with slides.Presentation() as presentation:
    slide = presentation.slides[0]

    chart = slide.shapes.add_chart(charts.ChartType.CLUSTERED_COLUMN, 20, 20, 500, 300)
    chart.axes.horizontal_axis.label_offset = 500

    presentation.save("SetCategoryAxisLabelDistance_out.pptx", slides.export.SaveFormat.PPTX)
調整標籤位置
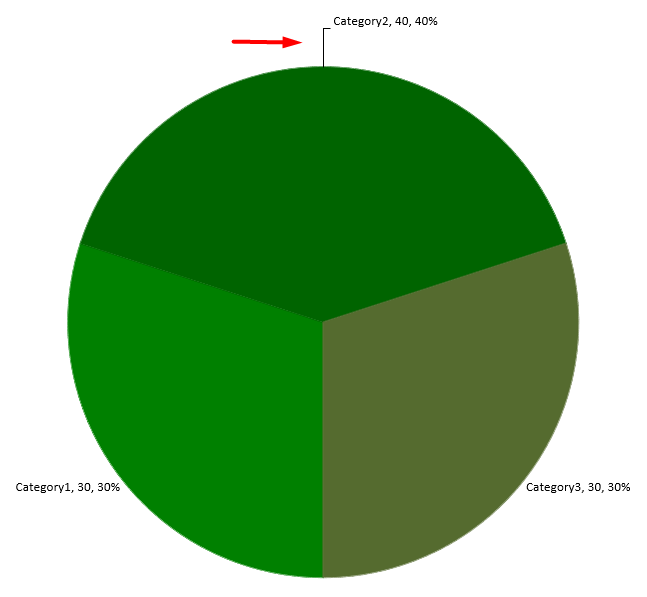
在圓餅圖上,調整資料標籤的位置以改善間距並為引線騰出空間。
此範例顯示第一個資料點的數值,將其標籤放置於切片外側,並調整其x 與y 偏移值。這些偏移值分別以圖表寬度與高度為基準。
import aspose.slides as slides
import aspose.slides.charts as charts

with slides.Presentation() as presentation:
    slide = presentation.slides[0]

    chart = slide.shapes.add_chart(charts.ChartType.PIE, 50, 50, 200, 200)
    series = chart.chart_data.series

    label = series[0].labels[0]
    label.data_label_format.show_value = True
    label.data_label_format.position = charts.LegendDataLabelPosition.OUTSIDE_END
    label.x = 0.71
    label.y = 0.04

    presentation.save("presentation.pptx", slides.export.SaveFormat.PPTX)
在直條圖上方加入多列資料標籤
此範例建立一個直條圖,在繪圖區上方設置兩列資料標籤。Series A 顯示可見的直條,Series B 與 Series C 提供額外的標籤。透過移除填滿與輪廓,使它們的直條隱藏。overlap 屬性使三個系列的類別中心對齊。
plot_area 設定為標籤列保留空間。於validate_chart_layout 計算預設位置後, x 與 y 保持水平對齊,並套用垂直偏移以將標籤排列為兩列。數字仍然是連結至系列數值的資料標籤;僅列標題是獨立的文字圖形。
import aspose.slides as slides
import aspose.slides.charts as charts
import aspose.pydrawing as drawing

with slides.Presentation() as presentation:
    slide = presentation.slides[0]

    chart = slide.shapes.add_chart(charts.ChartType.CLUSTERED_COLUMN, 40, 40, 640, 200)
    chart.has_title = False
    chart.has_legend = False
    chart.text_format.portion_format.font_height = 12

    chart.chart_data.series.clear()
    chart.chart_data.categories.clear()

    workbook = chart.chart_data.chart_data_workbook
    workbook.clear(0)

    categories = ["North", "South", "East", "West"]
    series_names = ["Series A", "Series B", "Series C"]
    series_values = [
        [35, 42, 28, 47],
        [22, 31, 19, 26],
        [12, 16, 14, 18]
    ]

    for category_index, category_name in enumerate(categories):
        category_cell = workbook.get_cell(0, category_index + 1, 0, category_name)
        chart.chart_data.categories.add(category_cell)

    for series_index, series_name in enumerate(series_names):
        series_cell = workbook.get_cell(0, 0, series_index + 1, series_name)
        series = chart.chart_data.series.add(series_cell, charts.ChartType.CLUSTERED_COLUMN)

        for category_index in range(len(categories)):
            value_cell = workbook.get_cell(0, category_index + 1, series_index + 1, series_values[series_index][category_index])
            series.data_points.add_data_point_for_bar_series(value_cell)

        if series_index > 0:
            # 隱藏 B 與 C 系列的欄位,但保留它們的資料標籤。
            series.format.fill.fill_type = slides.FillType.NO_FILL
            series.format.line.fill_format.fill_type = slides.FillType.NO_FILL
            label_format = series.labels.default_data_label_format
            label_format.show_value = True
            label_format.text_format.portion_format.font_height = 12
            label_fill = label_format.text_format.portion_format.fill_format
            label_fill.fill_type = slides.FillType.SOLID
            label_fill.solid_fill_color.color = drawing.Color.black
            label_format.position = charts.LegendDataLabelPosition.INSIDE_BASE

    # 將所有三個系列對齊到相同的類別中心。
    chart.chart_data.series[0].parent_series_group.overlap = 100

    # 此簡潔範例使用較少的格線。
    chart.axes.vertical_axis.is_automatic_major_unit = False
    chart.axes.vertical_axis.major_unit = 10

    # 在繪圖區上方保留空間以放置兩列資料標籤。
    chart.plot_area.layout_target_type = charts.LayoutTargetType.INNER
    chart.plot_area.x = 0.15
    chart.plot_area.y = 0.32
    chart.plot_area.width = 0.80
    chart.plot_area.height = 0.48
    chart.validate_chart_layout()

    for series_index in range(1, len(series_names)):
        series = chart.chart_data.series[series_index]
        row_top = 0.15 if series_index == 1 else 0.03

        for category_index in range(len(categories)):
            data_label = series.data_points[category_index].label
            # 保留預設的水平位置。Y 為相對於
            # 預設標籤位置的偏移量,以圖表高度比例表示。
            data_label.x = 0
            data_label.y = row_top - data_label.actual_y / chart.height

        # 僅列標題是獨立的文字圖形。
        row_heading = slide.shapes.add_auto_shape(slides.ShapeType.RECTANGLE, chart.x, chart.y + row_top * chart.height, 85, 18)
        row_heading.fill_format.fill_type = slides.FillType.NO_FILL
        row_heading.line_format.fill_format.fill_type = slides.FillType.NO_FILL
        row_heading.add_text_frame(series_names[series_index])
        row_heading.text_frame.text_frame_format.margin_top = 0
        row_heading.text_frame.text_frame_format.margin_bottom = 0
        heading_format = row_heading.text_frame.paragraphs[0].portions[0].portion_format
        heading_format.font_height = 12
        heading_format.fill_format.fill_type = slides.FillType.SOLID
        heading_format.fill_format.solid_fill_color.color = drawing.Color.black

    presentation.save("multiple-rows-of-labels.pptx", slides.export.SaveFormat.PPTX)

常見問答
如何防止在密集圖表上資料標籤重疊?
結合自動標籤放置、引線與縮小字型大小;如有需要,可隱藏某些欄位(例如類別),或僅對極端值或關鍵點顯示標籤。
如何僅對零、負值或空值停用標籤?
在啟用標籤前先篩選資料點,並依據規則對數值為 0、負值或遺失值的資料點停用顯示。
在匯出為 PDF/影像時,如何確保標籤樣式一致?
明確設定字型族與大小,並確認該字型在渲染環境中可用,以避免退回至預設字型。