
تخصيص محاور المخطط في العروض التقديمية باستخدام Python
نظرة عامة
تشرح هذه المقالة كيفية تخصيص محاور المخطط باستخدام Aspose.Slides for Python عبر Java. وتشمل القيم المحسوبة للمحور، تبديل صفوف وأعمدة المخطط، إظهار/إخفاء المحور، فواصل تسميات الفئات وعلامات الفواصل، الفئات التاريخية وتنسيقها، تدوير العنوان، موضع المحور، ووحدات العرض.
الحصول على القيم القصوى على المحور العمودي للمخطط
أنشئ Presentation وأضف مخطط مساحة ببيانات افتراضية. استدعِ validateChartLayout قبل قراءة القيم المحسوبة للمحور لضمان تحديث تخطيط المخطط.
اقرأ getActualMaxValue وgetActualMinValue لتحديد حدود المحور، وgetActualMajorUnit وgetActualMinorUnit لفواصل العلامات. يوفر getActualMajorUnitScale وgetActualMinorUnitScale مقاييس الوحدات الزمنية، وهي ذات صلة بمحاور التاريخ. يخزن المثال هذه القيم في متغيرات محلية ويحفظ المخطط.
import jpype
import asposeslides

if not jpype.isJVMStarted():
    jpype.startJVM()

from asposeslides.api import Presentation, ChartType, SaveFormat

presentation = Presentation()
try:
    slide = presentation.getSlides().get_Item(0)

    chart = slide.getShapes().addChart(ChartType.Area, 100, 100, 500, 350)
    chart.validateChartLayout()

    max_value = chart.getAxes().getVerticalAxis().getActualMaxValue()
    min_value = chart.getAxes().getVerticalAxis().getActualMinValue()

    major_unit = chart.getAxes().getVerticalAxis().getActualMajorUnit()
    minor_unit = chart.getAxes().getVerticalAxis().getActualMinorUnit()

    major_unit_scale = chart.getAxes().getVerticalAxis().getActualMajorUnitScale()
    minor_unit_scale = chart.getAxes().getVerticalAxis().getActualMinorUnitScale()

    presentation.save("AxisValues_out.pptx", SaveFormat.Pptx)
finally:
    presentation.dispose()
تبديل البيانات بين المحاور
استخدم switchRowColumn لتبادل أدوار السلاسل والفئات في بيانات المخطط. كل فئة سابقة تصبح سلسلة، وكل سلسلة سابقة تصبح فئة. يغيّر هذا طريقة تجميع البيانات؛ لكنه لا يبدل المحورين الأفقي والعمودي. يستخدم المثال setRange لربط البيانات الافتراضية بـ Sheet1!A1:D5، بما في ذلك صف الرأس وعمود الفئة، قبل تبديل الصفوف والأعمدة. يحفظ مخططًا بأربع سلاسل وثلاث فئات.
import jpype
import asposeslides

if not jpype.isJVMStarted():
    jpype.startJVM()

from asposeslides.api import Presentation, ChartType, SaveFormat

presentation = Presentation()
try:
    slide = presentation.getSlides().get_Item(0)

    chart = slide.getShapes().addChart(ChartType.ClusteredColumn, 100, 100, 400, 300)
    chart.getChartData().setRange("Sheet1!A1:D5")
    chart.getChartData().switchRowColumn()

    presentation.save("SwitchChartRowColumns_out.pptx", SaveFormat.Pptx)
finally:
    presentation.dispose()
إلغاء إظهار المحور العمودي لمخططات الخطوط
استدعِ setVisible مع False على المحور العمودي لإخفائه. ينشئ المثال مخطط خط ببيانات افتراضية ويحفظه مع إخفاء المحور العمودي.
import jpype
import asposeslides

if not jpype.isJVMStarted():
    jpype.startJVM()

from asposeslides.api import Presentation, ChartType, SaveFormat

presentation = Presentation()
try:
    slide = presentation.getSlides().get_Item(0)

    chart = slide.getShapes().addChart(ChartType.Line, 100, 100, 400, 300)
    chart.getAxes().getVerticalAxis().setVisible(False)

    presentation.save("HiddenVerticalAxis.pptx", SaveFormat.Pptx)
finally:
    presentation.dispose()
إلغاء إظهار المحور الأفقي لمخططات الخطوط
استدعِ setVisible مع False على المحور الأفقي لإخفائه. ينشئ المثال مخطط خط ببيانات افتراضية ويحفظه مع إخفاء المحور الأفقي.
import jpype
import asposeslides

if not jpype.isJVMStarted():
    jpype.startJVM()

from asposeslides.api import Presentation, ChartType, SaveFormat

presentation = Presentation()
try:
    slide = presentation.getSlides().get_Item(0)

    chart = slide.getShapes().addChart(ChartType.Line, 100, 100, 400, 300)
    chart.getAxes().getHorizontalAxis().setVisible(False)

    presentation.save("HiddenHorizontalAxis.pptx", SaveFormat.Pptx)
finally:
    presentation.dispose()
تغيير محور الفئة
استخدم setCategoryAxisType لاختيار محور فئة تاريخي أو نصي. يتطلب هذا المثال ملف ExistingChart.pptx، مع مخطط كأول شكل في الشريحة الأولى وخلايا الفئات تحتوي على قيم تاريخ Excel رقمية. يغيّر المحور الأفقي إلى محور تاريخ. استدعِ setAutomaticMajorUnit مع False، ثم setMajorUnit مع 1، وsetMajorUnitScale مع TimeUnitType.Months لتحديد العلامات الرئيسية بفواصل شهرية.
import jpype
import asposeslides

if not jpype.isJVMStarted():
    jpype.startJVM()

from asposeslides.api import Presentation, SaveFormat, CategoryAxisType, TimeUnitType

presentation = Presentation("ExistingChart.pptx")
try:
    slide = presentation.getSlides().get_Item(0)

    chart = slide.getShapes().get_Item(0)
    chart.getAxes().getHorizontalAxis().setCategoryAxisType(CategoryAxisType.Date)
    chart.getAxes().getHorizontalAxis().setAutomaticMajorUnit(False)
    chart.getAxes().getHorizontalAxis().setMajorUnit(1)
    chart.getAxes().getHorizontalAxis().setMajorUnitScale(TimeUnitType.Months)

    presentation.save("ChangeChartCategoryAxis_out.pptx", SaveFormat.Pptx)
finally:
    presentation.dispose()
التحكم في فواصل تسميات محور الفئة
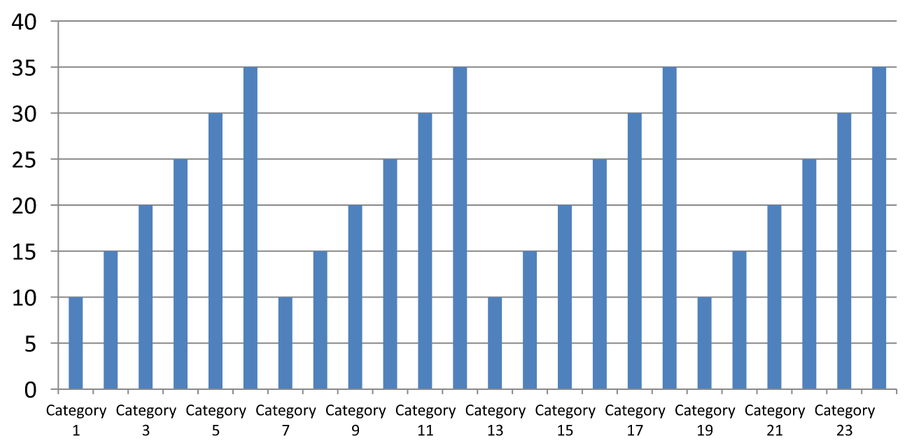
عند وجود عدد كبير من الفئات في المخطط، قلل عدد التسميات المرئية للمحور دون إزالة الفئات أو نقاط البيانات. استدعِ setAutomaticTickLabelSpacing مع False، ثم مرّر الفاصل المطلوب للفئة إلى setTickLabelSpacing. بالنسبة للفئات النصية بترتيبها العادي، يبدأ العد من الفئة الأولى:
| الفاصل | التسميات المعروضة في المثال |
|---|---|
1 |
الفئة 1, الفئة 2, الفئة 3, … الفئة 24 |
2 |
الفئة 1, الفئة 3, الفئة 5, … الفئة 23 |
3 |
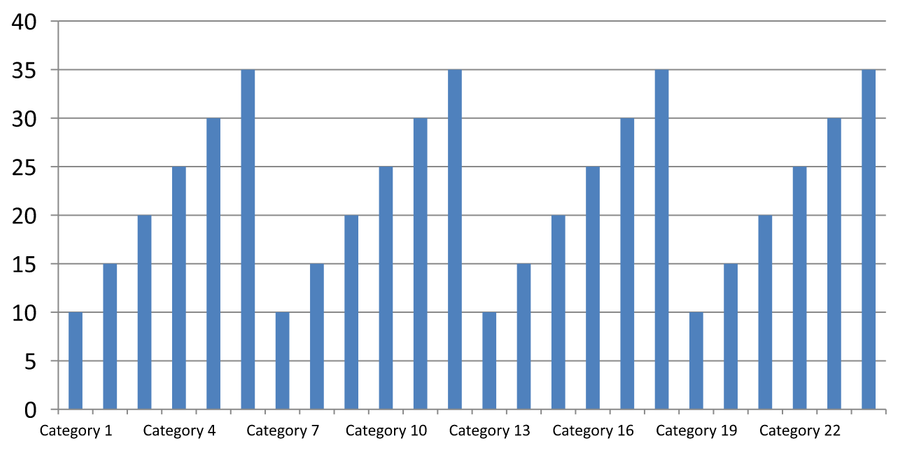
الفئة 1, الفئة 4, الفئة 7, … الفئة 22 |
يعرض الفاصل 3 كل تسمية ثالثة، مع إخفاء تسميتين بين كل تسمية مرئية. لا يزيل الأعمدة المقابلة. يختار التباعد التلقائي فاصلًا بناءً على المساحة المتاحة؛ ولا يضمن عرض كل تسمية.
لعلامات الفواصل تحكمات منفصلة. استدعِ setAutomaticTickMarksSpacing مع False واستخدم setTickMarksSpacing لتحديد فاصلها. على سبيل المثال، 1 يبقي علامة فاصل عند كل فاصل فئة بينما تظهر التسميات كل فئة ثالثة فقط. استخدم setMajorTickMark بنمط مرئي لتتمكن من رؤية النتيجة. إعادة استدعاء أي من مُعيّني التباعد التلقائي مع True يسمح للمخطط باختيار الفاصل مرة أخرى.
المثال المتكامل التالي يُنشئ 24 فئة وسلسلة واحدة، ثم يحفظ ثلاث شرائح في CategoryAxisIntervals.pptx: التباعد التلقائي، تباعد يدوي للتسميات مع علامات فواصل مستقلة، واستعادة التباعد التلقائي. النسختان تحتفظان ببيانات المخطط الأصلية. لا يلزم تقديم عرض تقديمي كمدخل. نص التسميات الأفقي يُظهر الفرق في الكثافة بسهولة.
import jpype
import asposeslides

if not jpype.isJVMStarted():
    jpype.startJVM()

from asposeslides.api import Presentation, ChartType, SaveFormat, CategoryAxisType, TickMarkType

presentation = Presentation()
try:
    slide = presentation.getSlides().get_Item(0)

    chart = slide.getShapes().addChart(ChartType.ClusteredColumn, 30, 40, 660, 320)

    chart.setLegend(False)
    chart.getChartData().getCategories().clear()
    chart.getChartData().getSeries().clear()

    workbook = chart.getChartData().getChartDataWorkbook()
    workbook.clear(0)

    series = chart.getChartData().getSeries().add(ChartType.ClusteredColumn)
    for i in range(24):
        category_cell = workbook.getCell(0, i + 1, 0, f"Category {i + 1}")
        chart.getChartData().getCategories().add(category_cell)
        value_cell = workbook.getCell(0, i + 1, 1, float(10 + i % 6 * 5))
        series.getDataPoints().addDataPointForBarSeries(value_cell)

    axis = chart.getAxes().getHorizontalAxis()
    axis.setCategoryAxisType(CategoryAxisType.Text)
    axis.getTextFormat().getTextBlockFormat().setRotationAngle(0)
    axis.getTextFormat().getPortionFormat().setFontHeight(12)
    axis.setMajorTickMark(TickMarkType.Outside)
    axis.setAutomaticTickLabelSpacing(True)
    axis.setAutomaticTickMarksSpacing(True)

    # الشريحة 2: إظهار كل تسمية ثالثة، مع الحفاظ على علامة فاصل لكل فئة.
    manual_slide = presentation.getSlides().addClone(slide)
    manual_chart = manual_slide.getShapes().get_Item(0)
    manual_axis = manual_chart.getAxes().getHorizontalAxis()
    manual_axis.setAutomaticTickLabelSpacing(False)
    manual_axis.setTickLabelSpacing(3)
    manual_axis.setAutomaticTickMarksSpacing(False)
    manual_axis.setTickMarksSpacing(1)

    # الشريحة 3: السماح للمخطط باختيار كلا الفاصلين مرة أخرى.
    restored_slide = presentation.getSlides().addClone(manual_slide)
    restored_chart = restored_slide.getShapes().get_Item(0)
    restored_chart.getAxes().getHorizontalAxis().setAutomaticTickLabelSpacing(True)
    restored_chart.getAxes().getHorizontalAxis().setAutomaticTickMarksSpacing(True)

    presentation.save("CategoryAxisIntervals.pptx", SaveFormat.Pptx)
finally:
    presentation.dispose()
التباعد التلقائي (الشريحة 1): في هذا العرض، تُعرض كل تسمية فئة ثانية وتلتف على سطرين. قد يختلف الناتج التلقائي مع حجم المخطط، الخطوط، وعامل العرض.
التباعد اليدوي (الشريحة 2): تُعرض كل تسمية ثالثة على سطر واحد، بينما تظل علامات الفواصل عند كل فاصل فئة. تظل جميع الأعمدة الـ24، بما فيها غير المتسمة، مرئية بنفس القيم. الشريحة 3 تستعيد المظهر التلقائي المعروض أعلاه.
اختر المحور والفاصل الصحيح
استخدم هذا الفاصل لعدد الفئات لمحور فئة نصية، مثل محور الفئة في مخطط عمودي، خطي، مساحة أو شريطي. في المخطط العمودي يكون هو المحور الأفقي. في المخطط الشريطي الأفقي يكون محور الفئة عموديًا، لذلك طبق هذه الإعدادات على المحور الذي تُعيده getVerticalAxis. ينطبق تباعد علامات الفواصل أيضًا على محور السلسلة في المخططات التي تحتوي على واحد.
لا تستخدم تباعد تسميات الفئة لتحديد مقياس عددي لمحور القيمة. على محور القيمة، يحدد setMajorUnit فرق القيم: على سبيل المثال، وحدة رئيسية 10 تنتج علامات عند 0، 10، 20، وهكذا عندما يبدأ المحور من الصفر. بينما فاصل تسمية الفئة 3 يعد مواضع الفئات بغض النظر عن قيمها. تستخدم مخططات التشتت والفقاعة محاور قيمة بدلاً من محور فئة نصية. بالنسبة لمحور التاريخ، استخدم الوحدات الزمنية الرئيسية والمقاييس كما هو موضح في Change a Category Axis.
تحديد تنسيق التاريخ لقيم محور الفئة
يستبدل المثال البيانات الافتراضية للمخطط بأربع قيم سنوية. تُخزن التواريخ كأرقام متسلسلة OLE Automation في ورقة العمل الأولى (الفهرس 0)، محسوبة كعدد الأيام منذ 30 ديسمبر 1899. استخدم setCategoryAxisType مع CategoryAxisType.Date، استدعِ setNumberFormatLinkedToSource مع False، ومرّر yyyy إلى setNumberFormat لعرض تسميات الفئة بأربع سنوات رقمية مستقلة عن تنسيق الخلية.
from datetime import date

import jpype
import asposeslides

if not jpype.isJVMStarted():
    jpype.startJVM()

from asposeslides.api import Presentation, ChartType, SaveFormat, CategoryAxisType

presentation = Presentation()
try:
    slide = presentation.getSlides().get_Item(0)

    chart = slide.getShapes().addChart(ChartType.Line, 50, 50, 450, 300)

    chart.getChartData().getCategories().clear()
    chart.getChartData().getSeries().clear()

    workbook = chart.getChartData().getChartDataWorkbook()
    workbook.clear(0)

    base_date = date(1899, 12, 30)

    series = chart.getChartData().getSeries().add(ChartType.Line)
    for i in range(4):
        category_date = date(2015 + i, 1, 1)
        category_value = float((category_date - base_date).days)
        category_cell = workbook.getCell(0, i + 1, 0, category_value)
        chart.getChartData().getCategories().add(category_cell)

        value_cell = workbook.getCell(0, i + 1, 1, float(i + 1))
        series.getDataPoints().addDataPointForLineSeries(value_cell)

    chart.getAxes().getHorizontalAxis().setCategoryAxisType(CategoryAxisType.Date)
    chart.getAxes().getHorizontalAxis().setNumberFormatLinkedToSource(False)
    chart.getAxes().getHorizontalAxis().setNumberFormat("yyyy")

    presentation.save("DateAxisFormat.pptx", SaveFormat.Pptx)
finally:
    presentation.dispose()
تعيين زاوية الدوران لعنوان محور المخطط
استدعِ setTitle مع True على المحور العمودي، قدّم نص العنوان، واضبط زاوية الدوران في تنسيق كتلة نص العنوان. تُقاس الزاوية بالدرجات؛ يحفظ هذا المثال مخطط عمودي بعنوان محور القيمة مائلًا بزاوية 90 درجة.
import jpype
import asposeslides

if not jpype.isJVMStarted():
    jpype.startJVM()

from asposeslides.api import Presentation, ChartType, SaveFormat

presentation = Presentation()
try:
    slide = presentation.getSlides().get_Item(0)

    chart = slide.getShapes().addChart(ChartType.ClusteredColumn, 50, 50, 450, 300)
    chart.getAxes().getVerticalAxis().setTitle(True)
    chart.getAxes().getVerticalAxis().getTitle().addTextFrameForOverriding("Value")
    chart.getAxes().getVerticalAxis().getTitle().getTextFormat().getTextBlockFormat().setRotationAngle(90)

    presentation.save("RotatedAxisTitle.pptx", SaveFormat.Pptx)
finally:
    presentation.dispose()
تعيين موضع المحور على محور الفئة أو القيمة
استخدم setAxisBetweenCategories للتحكم فيما إذا كان محور القيمة يقطع محور الفئة بين الفئات أو عند علامات الفئات. ينطبق هذا الإعداد على محاور الفئات. يضبط المثال القيمة إلى True على محور الفئة الأفقي لمخطط عمودي ويحفظ النتيجة.
import jpype
import asposeslides

if not jpype.isJVMStarted():
    jpype.startJVM()

from asposeslides.api import Presentation, ChartType, SaveFormat

presentation = Presentation()
try:
    slide = presentation.getSlides().get_Item(0)

    chart = slide.getShapes().addChart(ChartType.ClusteredColumn, 50, 50, 450, 300)
    chart.getAxes().getHorizontalAxis().setAxisBetweenCategories(True)

    presentation.save("AxisBetweenCategories.pptx", SaveFormat.Pptx)
finally:
    presentation.dispose()
تعيين وحدة العرض على محور قيمة المخطط
استخدم setDisplayUnit لتقليل حجم التسميات على محور القيمة دون تغيير البيانات الأساسية. مع تعيين DisplayUnitType إلى Millions، تُعرض القيمة 60,000,000 كـ 60. يُنشئ المثال مخططًا عموديًا ويطبق وحدة العرض بالملايين على محوره العمودي.
import jpype
import asposeslides

if not jpype.isJVMStarted():
    jpype.startJVM()

from asposeslides.api import Presentation, ChartType, SaveFormat, DisplayUnitType

presentation = Presentation()
try:
    slide = presentation.getSlides().get_Item(0)

    chart = slide.getShapes().addChart(ChartType.ClusteredColumn, 50, 50, 450, 300)
    chart.getAxes().getVerticalAxis().setDisplayUnit(DisplayUnitType.Millions)

    presentation.save("Result.pptx", SaveFormat.Pptx)
finally:
    presentation.dispose()
الأسئلة الشائعة
كيف يمكنني تعيين القيمة التي يتقاطع عندها محور مع الآخر (تقاطع المحاور)؟
استخدم setCrossType لاختيار سلوك التقاطع. لتحديد قيمة تقاطع عددية، استخدم setCrossAt. تتيح لك هذه الإعدادات تحريك تقاطع المحور إلى خط أساس مناسب.
كيف يمكنني وضع تسميات العلامات النقطية بالنسبة للمحور؟
استدعِ setTickLabelPosition باستخدام TickLabelPositionType: Low، High، NextTo، أو None. للتحكم في علامات الفواصل نفسها، استخدم setMajorTickMark أو setMinorTickMark؛ فهذان منفصلان عن موضع التسميات.