
ปรับแต่งแกนแผนภูมิในงานนำเสนอด้วย C++
ภาพรวม
บทความนี้อธิบายวิธีการปรับแต่งแกนของแผนภูมิด้วย Aspose.Slides for C++. ซึ่งครอบคลุมค่าของแกนที่คำนวณ, การสลับแถวและคอลัมน์ของแผนภูมิ, การแสดงหรือซ่อนแกน, ช่วงเวลาของป้ายชื่อประเภทและเครื่องหมายทิก, ประเภทวันที่และการจัดรูปแบบ, การหมุนชื่อเรื่อง, การกำหนดตำแหน่งแกน, และหน่วยการแสดงผล.
รับค่ามากสุดบนแกนแนวตั้งของแผนภูมิ
สร้าง งานนำเสนอ และเพิ่มแผนภูมิแบบพื้นที่พร้อมข้อมูลเริ่มต้น เรียกใช้ ValidateChartLayout ก่อนอ่านค่าของแกนที่คำนวณ เพื่อให้การจัดวางแผนภูมิมีความเป็นปัจจุบัน
อ่าน get_ActualMaxValue และ get_ActualMinValue สำหรับขอบเขตของแกน, และ get_ActualMajorUnit และ get_ActualMinorUnit สำหรับช่วงของเครื่องหมายทิก. get_ActualMajorUnitScale และ get_ActualMinorUnitScale ให้สเกลหน่วยเวลา, ซึ่งเกี่ยวข้องกับแกนวันที่. ตัวอย่างนี้เก็บค่าต่าง ๆ ไว้ในตัวแปรท้องถิ่นและบันทึกแผนภูมิ
#include <DOM/Presentation.h>
#include <DOM/ISlide.h>
#include <DOM/IShapeCollection.h>
#include <DOM/IChart.h>
#include <DOM/Chart/ChartType.h>
#include <DOM/Chart/IAxesManager.h>
#include <DOM/Chart/IAxis.h>
#include <Export/SaveFormat.h>

using namespace Aspose::Slides;
using namespace Aspose::Slides::Charts;
using namespace Aspose::Slides::Export;

auto presentation = System::MakeObject<Presentation>();
auto slide = presentation->get_Slide(0);

auto chart = slide->get_Shapes()->AddChart(ChartType::Area, 100, 100, 500, 350);
chart->ValidateChartLayout();

auto maxValue = chart->get_Axes()->get_VerticalAxis()->get_ActualMaxValue();
auto minValue = chart->get_Axes()->get_VerticalAxis()->get_ActualMinValue();

auto majorUnit = chart->get_Axes()->get_VerticalAxis()->get_ActualMajorUnit();
auto minorUnit = chart->get_Axes()->get_VerticalAxis()->get_ActualMinorUnit();

auto majorUnitScale = chart->get_Axes()->get_VerticalAxis()->get_ActualMajorUnitScale();
auto minorUnitScale = chart->get_Axes()->get_VerticalAxis()->get_ActualMinorUnitScale();

presentation->Save(u"AxisValues_out.pptx", SaveFormat::Pptx);
สลับข้อมูลระหว่างแกน
ใช้ SwitchRowColumn เพื่อสลับบทบาทของซีรีส์และประเภทในข้อมูลแผนภูมิ แต่ละประเภทเดิมจะกลายเป็นซีรีส์, และแต่ละซีรีส์เดิมจะกลายเป็นประเภท. สิ่งนี้เปลี่ยนวิธีการจัดกลุ่มข้อมูล; ไม่ได้สลับแกนแนวนอนและแนวตั้ง. ตัวอย่างใช้ SetRange เพื่อผูกข้อมูลเริ่มต้นกับ Sheet1!A1:D5, รวมทั้งแถวหัวและคอลัมน์ประเภท, ก่อนทำการสลับแถวและคอลัมน์. มันบันทึกแผนภูมิที่มีสี่ซีรีส์และสามประเภท
#include <DOM/Presentation.h>
#include <DOM/ISlide.h>
#include <DOM/IShapeCollection.h>
#include <DOM/IChart.h>
#include <DOM/Chart/ChartType.h>
#include <DOM/Chart/IAxesManager.h>
#include <DOM/Chart/IAxis.h>
#include <Export/SaveFormat.h>
#include <DOM/Chart/IChartData.h>

using namespace Aspose::Slides;
using namespace Aspose::Slides::Charts;
using namespace Aspose::Slides::Export;

auto presentation = System::MakeObject<Presentation>();
auto slide = presentation->get_Slide(0);

auto chart = slide->get_Shapes()->AddChart(ChartType::ClusteredColumn, 100, 100, 400, 300);

chart->get_ChartData()->SetRange(u"Sheet1!A1:D5");
chart->get_ChartData()->SwitchRowColumn();

presentation->Save(u"SwitchChartRowColumns_out.pptx", SaveFormat::Pptx);
ปิดการใช้งานแกนแนวตั้งสำหรับแผนภูมิเส้น
ใช้ set_IsVisible พร้อมค่า false บนแกนแนวตั้งเพื่อซ่อนมัน. ตัวอย่างสร้างแผนภูมิเส้นพร้อมข้อมูลเริ่มต้นและบันทึกโดยมีแกนแนวตั้งซ่อนอยู่
#include <DOM/Presentation.h>
#include <DOM/ISlide.h>
#include <DOM/IShapeCollection.h>
#include <DOM/IChart.h>
#include <DOM/Chart/ChartType.h>
#include <DOM/Chart/IAxesManager.h>
#include <DOM/Chart/IAxis.h>
#include <Export/SaveFormat.h>

using namespace Aspose::Slides;
using namespace Aspose::Slides::Charts;
using namespace Aspose::Slides::Export;

auto presentation = System::MakeObject<Presentation>();
auto slide = presentation->get_Slide(0);

auto chart = slide->get_Shapes()->AddChart(ChartType::Line, 100, 100, 400, 300);
chart->get_Axes()->get_VerticalAxis()->set_IsVisible(false);

presentation->Save(u"HiddenVerticalAxis.pptx", SaveFormat::Pptx);
ปิดการใช้งานแกนแนวนอนสำหรับแผนภูมิเส้น
ใช้ set_IsVisible พร้อมค่า false บนแกนแนวนอนเพื่อซ่อนมัน. ตัวอย่างสร้างแผนภูมิเส้นพร้อมข้อมูลเริ่มต้นและบันทึกโดยมีแกนแนวนอนซ่อนอยู่
#include <DOM/Presentation.h>
#include <DOM/ISlide.h>
#include <DOM/IShapeCollection.h>
#include <DOM/IChart.h>
#include <DOM/Chart/ChartType.h>
#include <DOM/Chart/IAxesManager.h>
#include <DOM/Chart/IAxis.h>
#include <Export/SaveFormat.h>

using namespace Aspose::Slides;
using namespace Aspose::Slides::Charts;
using namespace Aspose::Slides::Export;

auto presentation = System::MakeObject<Presentation>();
auto slide = presentation->get_Slide(0);

auto chart = slide->get_Shapes()->AddChart(ChartType::Line, 100, 100, 400, 300);
chart->get_Axes()->get_HorizontalAxis()->set_IsVisible(false);

presentation->Save(u"HiddenHorizontalAxis.pptx", SaveFormat::Pptx);
เปลี่ยนแกนประเภท
ใช้ set_CategoryAxisType เพื่อเลือกแกนประเภทเป็นวันที่หรือข้อความ ตัวอย่างนี้ต้องการไฟล์ ExistingChart.pptx, โดยมีแผนภูมิเป็นรูปร่างแรกบนสไลด์แรกและเซลล์ประเภทมีค่าตัวเลขวันที่ของ Excel. มันเปลี่ยนแกนแนวนอนเป็นแกนวันที่. เรียก set_IsAutomaticMajorUnit พร้อมค่า false, set_MajorUnit พร้อมค่า 1, และ set_MajorUnitScale เป็นเดือน เพื่อวางเครื่องหมายทิกหลักที่ช่วงหนึ่งเดือน
#include <DOM/Presentation.h>
#include <DOM/ISlide.h>
#include <DOM/IShapeCollection.h>
#include <DOM/IChart.h>
#include <DOM/Chart/ChartType.h>
#include <DOM/Chart/IAxesManager.h>
#include <DOM/Chart/IAxis.h>
#include <Export/SaveFormat.h>
#include <DOM/Chart/CategoryAxisType.h>
#include <DOM/Chart/TimeUnitType.h>
#include <system/object_ext.h>

using namespace Aspose::Slides;
using namespace Aspose::Slides::Charts;
using namespace Aspose::Slides::Export;

auto presentation = System::MakeObject<Presentation>(u"ExistingChart.pptx");
auto slide = presentation->get_Slide(0);

auto chart = System::ExplicitCast<IChart>(slide->get_Shape(0));
chart->get_Axes()->get_HorizontalAxis()->set_CategoryAxisType(CategoryAxisType::Date);
chart->get_Axes()->get_HorizontalAxis()->set_IsAutomaticMajorUnit(false);
chart->get_Axes()->get_HorizontalAxis()->set_MajorUnit(1);
chart->get_Axes()->get_HorizontalAxis()->set_MajorUnitScale(TimeUnitType::Months);

presentation->Save(u"ChangeChartCategoryAxis_out.pptx", SaveFormat::Pptx);
ควบคุมช่วงป้ายชื่อแกนประเภท
เมื่อแผนภูมิมีหลายประเภท, ลดจำนวนป้ายชื่อแกนที่มองเห็นได้โดยไม่ต้องลบประเภทหรือจุดข้อมูล. ใช้ set_IsAutomaticTickLabelSpacing พร้อมค่า false, แล้วใช้ set_TickLabelSpacing พร้อมช่วงประเภทที่ต้องการ. สำหรับประเภทข้อความในลำดับปกติ, การนับเริ่มจากประเภทแรก:
| ช่วง | ป้ายกำกับที่แสดงในตัวอย่าง |
|---|---|
1 |
ประเภท 1, ประเภท 2, ประเภท 3, … ประเภท 24 |
2 |
ประเภท 1, ประเภท 3, ประเภท 5, … ประเภท 23 |
3 |
ประเภท 1, ประเภท 4, ประเภท 7, … ประเภท 22 |
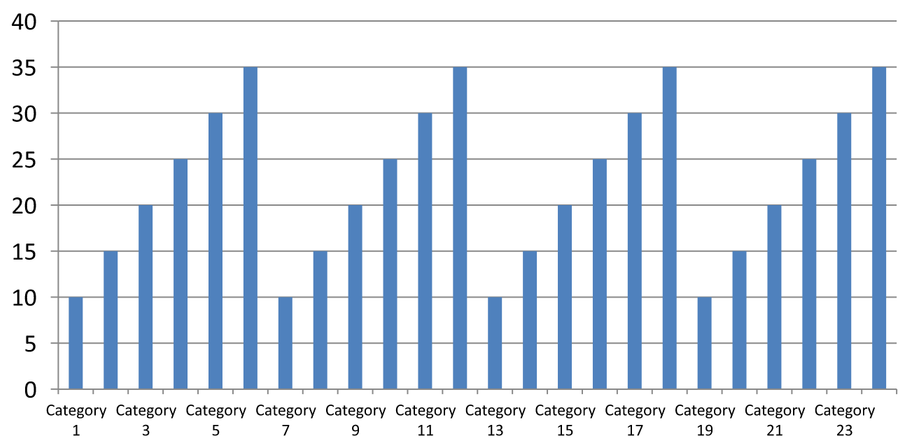
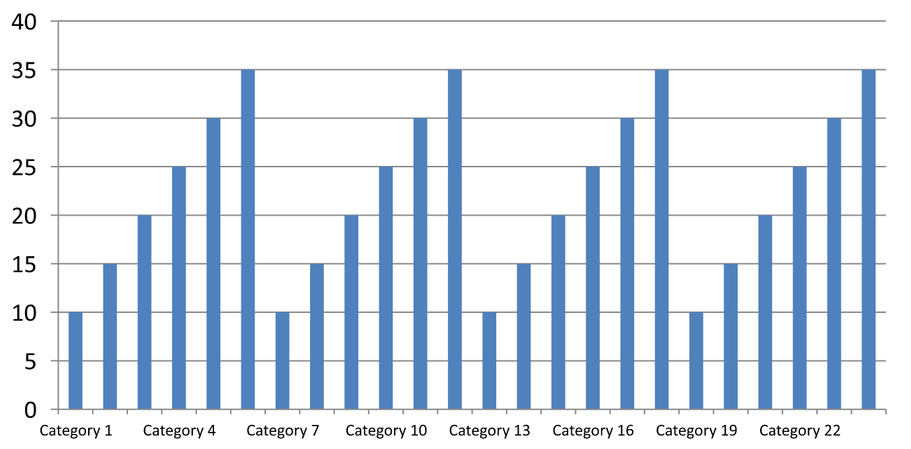
ช่วง 3 จะแสดงป้ายทุกสามรายการ, ทำให้มีสองป้ายที่ซ่อนอยู่ระหว่างป้ายที่แสดง. ไม่ได้ลบคอลัมน์ที่สอดคล้อง. การเว้นระยะอัตโนมัติเลือกช่วงตามพื้นที่ที่มี; ไม่ได้จำเป็นต้องแสดงทุกป้าย
เครื่องหมายทิกมีการควบคุมแยกกัน. ใช้ set_IsAutomaticTickMarksSpacing พร้อมค่า false และใช้ set_TickMarksSpacing เพื่อกำหนดช่วงของมัน. ตัวอย่างเช่น, 1 จะคงเครื่องหมายทิกที่ทุกช่วงประเภทในขณะที่ป้ายชื่อปรากฏแค่ทุกสามประเภท. ใช้ set_MajorTickMark พร้อมสไตล์ที่มองเห็นได้เพื่อให้คุณเห็นผลลัพธ์. การตั้งค่าคุณสมบัติการเว้นระยะอัตโนมัติใด ๆ กลับเป็น true จะทำให้แผนภูมิเ�เลือกช่วงนั้นอีกครั้ง
ตัวอย่างต่อไปนี้สร้าง 24 ประเภทและหนึ่งซีรีส์, จากนั้นบันทึกสามสไลด์ในไฟล์ CategoryAxisIntervals.pptx: การเว้นระยะอัตโนมัติ, การเว้นระยะด้วยตนเองพร้อมเครื่องหมายทิกอิสระ, และการคืนค่าเว้นระยะอัตโนมัติ. ทั้งสองสำเนารักษาข้อมูลแผนภูมิดั้งเดิม. ไม่จำเป็นต้องมีไฟล์งานนำเสนอเข้า. ข้อความป้ายระดับแนวนอนทำให้เห็นความหนาแน่นได้ง่าย
#include <DOM/Presentation.h>
#include <DOM/ISlide.h>
#include <DOM/IShapeCollection.h>
#include <DOM/IChart.h>
#include <DOM/Chart/ChartType.h>
#include <DOM/Chart/IAxesManager.h>
#include <DOM/Chart/IAxis.h>
#include <Export/SaveFormat.h>
#include <DOM/Chart/IChartData.h>
#include <DOM/Chart/CategoryAxisType.h>
#include <DOM/Chart/TickMarkType.h>
#include <DOM/Chart/IChartTextFormat.h>
#include <DOM/Chart/IChartTextBlockFormat.h>
#include <DOM/Chart/IChartPortionFormat.h>
#include <DOM/Chart/IChartDataWorkbook.h>
#include <DOM/Chart/IChartDataCell.h>
#include <DOM/Chart/IChartCategoryCollection.h>
#include <DOM/Chart/IChartSeriesCollection.h>
#include <DOM/Chart/IChartSeries.h>
#include <DOM/Chart/IChartDataPointCollection.h>
#include <system/object_ext.h>
#include <DOM/ISlideCollection.h>

using namespace Aspose::Slides;
using namespace Aspose::Slides::Charts;
using namespace Aspose::Slides::Export;

auto presentation = System::MakeObject<Presentation>();
auto slide = presentation->get_Slide(0);

auto chart = slide->get_Shapes()->AddChart(ChartType::ClusteredColumn, 30, 40, 660, 320);

chart->set_HasLegend(false);
chart->get_ChartData()->get_Categories()->Clear();
chart->get_ChartData()->get_Series()->Clear();

auto workbook = chart->get_ChartData()->get_ChartDataWorkbook();
workbook->Clear(0);

auto series = chart->get_ChartData()->get_Series()->Add(ChartType::ClusteredColumn);
for (auto i = 0; i < 24; i++)
{
    auto categoryName = System::String::Format(u"Category {0}", i + 1);
    auto categoryCell = workbook->GetCell(0, i + 1, 0, System::ObjectExt::Box(categoryName));
    chart->get_ChartData()->get_Categories()->Add(categoryCell);
    auto valueCell = workbook->GetCell(0, i + 1, 1, System::ObjectExt::Box(10 + i % 6 * 5));
    series->get_DataPoints()->AddDataPointForBarSeries(valueCell);
}

auto axis = chart->get_Axes()->get_HorizontalAxis();
axis->set_CategoryAxisType(CategoryAxisType::Text);
axis->get_TextFormat()->get_TextBlockFormat()->set_RotationAngle(0);
axis->get_TextFormat()->get_PortionFormat()->set_FontHeight(12);
axis->set_MajorTickMark(TickMarkType::Outside);
axis->set_IsAutomaticTickLabelSpacing(true);
axis->set_IsAutomaticTickMarksSpacing(true);

// Slide 2: แสดงทุกป้ายที่สาม แต่ยังคงมีเครื่องหมายทิกสำหรับทุกประเภท.
auto manualSlide = presentation->get_Slides()->AddClone(slide);
auto manualChart = System::ExplicitCast<IChart>(manualSlide->get_Shape(0));
auto manualAxis = manualChart->get_Axes()->get_HorizontalAxis();
manualAxis->set_IsAutomaticTickLabelSpacing(false);
manualAxis->set_TickLabelSpacing(3);
manualAxis->set_IsAutomaticTickMarksSpacing(false);
manualAxis->set_TickMarksSpacing(1);

// Slide 3: ให้แผนภูมิเพิ่มเลือกช่วงทั้งสองใหม่อีกครั้ง.
auto restoredSlide = presentation->get_Slides()->AddClone(manualSlide);
auto restoredChart = System::ExplicitCast<IChart>(restoredSlide->get_Shape(0));
restoredChart->get_Axes()->get_HorizontalAxis()->set_IsAutomaticTickLabelSpacing(true);
restoredChart->get_Axes()->get_HorizontalAxis()->set_IsAutomaticTickMarksSpacing(true);

presentation->Save(u"CategoryAxisIntervals.pptx", SaveFormat::Pptx);
การเว้นระยะอัตโนมัติ (สไลด์ 1): ในการแสดงผลนี้, ป้ายชื่อประเภททุกสองรายการจะถูกแสดงและตัดบรรทัดเป็นสองบรรทัด. ผลลัพธ์อัตโนมัติอาจแตกต่างตามขนาดแผนภูมิ, ฟอนต์, และเครื่องเรนเดอร์
การเว้นระยะด้วยตนเอง (สไลด์ 2): ป้ายชื่อทุกสามรายการจะแสดงบนบรรทัดเดียว, ในขณะที่เครื่องหมายทิกยังคงอยู่ที่ทุกช่วงประเภท. ทั้ง 24 คอลัมน์, รวมถึงคอลัมน์ที่ไม่มีป้ายชื่อ, ยังมองเห็นได้ด้วยค่าเดียวกัน. สไลด์ 3 คืนค่าappearanceอัตโนมัติที่แสดงข้างบน
เลือกแกนและช่วงที่ถูกต้อง
ใช้ช่วงจำนวนประเภทนี้สำหรับแกนประเภทข้อความ, เช่นแกนประเภทของแผนภูมิคอลัมน์, เส้น, พื้นที่, หรือแถบ. ในแผนภูมิคอลัมน์, มันเป็นแกนแนวนอน. ในแผนภูมิแถบแนวนอน, แกนประเภทอยู่ในแนวตั้ง, ดังนั้นให้ใช้การตั้งค่านี้กับ get_VerticalAxis. การเว้นระยะเครื่องหมายทิกยังใช้กับแกนซีรีส์ในแผนภูมิที่มีแกนนั้นด้วย
ห้ามใช้การเว้นระยะป้ายชื่อประเภทเพื่อกำหนดสเกลเชิงตัวเลขของแกนค่า. บนแกนค่า, set_MajorUnit ระบุความแตกต่างของค่า: ตัวอย่างเช่น, หน่วยหลัก 10 จะสร้างเครื่องหมายทิกที่ 0, 10, 20 เป็นต้นเมื่อแกนเริ่มที่ศูนย์. ช่วงป้ายชื่อประเภท 3 นับตำแหน่งประเภทแทนค่าข้อมูล. แผนภูมิสแคทเตอร์และบับเบิ้ลใช้แกนค่าแทนแกนประเภทข้อความ. สำหรับแกนวันที่, ใช้หน่วยหลักและสเกลตามเวลาอย่างที่อธิบายใน Change a Category Axis
กำหนดรูปแบบวันที่สำหรับค่าของแกนประเภท
ตัวอย่างนี้แทนค่าข้อมูลแผนภูมิโดยค่าเริ่มต้นด้วยค่าประจำปีสี่ค่า. วันที่ถูกจัดเก็บเป็นเลขอนุกรม OLE Automation ในเวิร์กชีตแรก (ดัชนี 0). ใช้ set_CategoryAxisType เพื่อเลือกแกนวันที่, ปิดการจัดรูปแบบที่เชื่อมโยงกับแหล่งข้อมูลด้วย set_IsNumberFormatLinkedToSource, และกำหนด yyyy ด้วย set_NumberFormat เพื่อให้ป้ายชื่อประเภทแสดงปีสี่หลักโดยอิสระจากการจัดรูปแบบของเซลล์
#include <DOM/Presentation.h>
#include <DOM/ISlide.h>
#include <DOM/IShapeCollection.h>
#include <DOM/IChart.h>
#include <DOM/Chart/ChartType.h>
#include <DOM/Chart/IAxesManager.h>
#include <DOM/Chart/IAxis.h>
#include <Export/SaveFormat.h>
#include <DOM/Chart/IChartData.h>
#include <DOM/Chart/CategoryAxisType.h>
#include <DOM/Chart/IChartDataWorkbook.h>
#include <DOM/Chart/IChartDataCell.h>
#include <DOM/Chart/IChartCategoryCollection.h>
#include <DOM/Chart/IChartSeriesCollection.h>
#include <DOM/Chart/IChartSeries.h>
#include <DOM/Chart/IChartDataPointCollection.h>
#include <system/object_ext.h>
#include <system/date_time.h>

using namespace Aspose::Slides;
using namespace Aspose::Slides::Charts;
using namespace Aspose::Slides::Export;

auto presentation = System::MakeObject<Presentation>();
auto slide = presentation->get_Slide(0);

auto chart = slide->get_Shapes()->AddChart(ChartType::Line, 50, 50, 450, 300);

chart->get_ChartData()->get_Categories()->Clear();
chart->get_ChartData()->get_Series()->Clear();

auto workbook = chart->get_ChartData()->get_ChartDataWorkbook();
workbook->Clear(0);

auto series = chart->get_ChartData()->get_Series()->Add(ChartType::Line);
for (auto i = 0; i < 4; i++)
{
    auto date = System::DateTime(2015 + i, 1, 1);
    auto categoryCell = workbook->GetCell(0, i + 1, 0, System::ObjectExt::Box(date.ToOADate()));
    chart->get_ChartData()->get_Categories()->Add(categoryCell);

    auto valueCell = workbook->GetCell(0, i + 1, 1, System::ObjectExt::Box(i + 1));
    series->get_DataPoints()->AddDataPointForLineSeries(valueCell);
}

chart->get_Axes()->get_HorizontalAxis()->set_CategoryAxisType(CategoryAxisType::Date);
chart->get_Axes()->get_HorizontalAxis()->set_IsNumberFormatLinkedToSource(false);
chart->get_Axes()->get_HorizontalAxis()->set_NumberFormat(u"yyyy");

presentation->Save(u"DateAxisFormat.pptx", SaveFormat::Pptx);
กำหนดมุมการหมุนสำหรับชื่อเรื่องของแกนแผนภูมิ
เปิดใช้งานชื่อแกนแนวตั้งด้วย set_HasTitle, ให้ข้อความชื่อเรื่อง, และใช้ set_RotationAngle เพื่อหมุนชื่อเรื่อง. มุมวัดเป็นองศา; ตัวอย่างนี้บันทึกแผนภูมิคอลัมน์ที่ชื่อแกนค่าถูกหมุน 90 องศา
#include <DOM/Presentation.h>
#include <DOM/ISlide.h>
#include <DOM/IShapeCollection.h>
#include <DOM/IChart.h>
#include <DOM/Chart/ChartType.h>
#include <DOM/Chart/IAxesManager.h>
#include <DOM/Chart/IAxis.h>
#include <Export/SaveFormat.h>
#include <DOM/Chart/IChartTextFormat.h>
#include <DOM/Chart/IChartTextBlockFormat.h>
#include <DOM/Chart/IChartTitle.h>

using namespace Aspose::Slides;
using namespace Aspose::Slides::Charts;
using namespace Aspose::Slides::Export;

auto presentation = System::MakeObject<Presentation>();
auto slide = presentation->get_Slide(0);

auto chart = slide->get_Shapes()->AddChart(ChartType::ClusteredColumn, 50, 50, 450, 300);
chart->get_Axes()->get_VerticalAxis()->set_HasTitle(true);
chart->get_Axes()->get_VerticalAxis()->get_Title()->AddTextFrameForOverriding(u"Value");
chart->get_Axes()->get_VerticalAxis()->get_Title()->get_TextFormat()->get_TextBlockFormat()->set_RotationAngle(90);

presentation->Save(u"RotatedAxisTitle.pptx", SaveFormat::Pptx);
ตั้งตำแหน่งแกนบนแกนประเภทหรือแกนค่า
ใช้ set_AxisBetweenCategories เพื่อควบคุมว่ากล่ะแกนค่าจะตัดผ่านแกนประเภทระหว่างประเภทหรือที่เครื่องหมายทิกของประเภท. คุณสมบัตินี้ใช้กับแกนประเภท. ตัวอย่างตั้งเป็น true บนแกนประเภทแนวนอนของแผนภูมิคอลัมน์และบันทึกผลลัพธ์
#include <DOM/Presentation.h>
#include <DOM/ISlide.h>
#include <DOM/IShapeCollection.h>
#include <DOM/IChart.h>
#include <DOM/Chart/ChartType.h>
#include <DOM/Chart/IAxesManager.h>
#include <DOM/Chart/IAxis.h>
#include <Export/SaveFormat.h>

using namespace Aspose::Slides;
using namespace Aspose::Slides::Charts;
using namespace Aspose::Slides::Export;

auto presentation = System::MakeObject<Presentation>();
auto slide = presentation->get_Slide(0);

auto chart = slide->get_Shapes()->AddChart(ChartType::ClusteredColumn, 50, 50, 450, 300);
chart->get_Axes()->get_HorizontalAxis()->set_AxisBetweenCategories(true);

presentation->Save(u"AxisBetweenCategories.pptx", SaveFormat::Pptx);
ตั้งหน่วยการแสดงผลบนแกนค่าของแผนภูมิ
ใช้ set_DisplayUnit เพื่อปรับสเกลป้ายกำกับบนแกนค่าโดยไม่เปลี่ยนข้อมูลพื้นฐาน. เมื่อ DisplayUnitType ตั้งเป็น Millions, ค่าที่ 60,000,000 จะถูกแสดงเป็น 60. ตัวอย่างสร้างแผนภูมิคอลัมน์และใช้หน่วยแสดงผลเป็นล้านบนแกนแนวตั้ง
#include <DOM/Presentation.h>
#include <DOM/ISlide.h>
#include <DOM/IShapeCollection.h>
#include <DOM/IChart.h>
#include <DOM/Chart/ChartType.h>
#include <DOM/Chart/IAxesManager.h>
#include <DOM/Chart/IAxis.h>
#include <Export/SaveFormat.h>
#include <DOM/Chart/DisplayUnitType.h>

using namespace Aspose::Slides;
using namespace Aspose::Slides::Charts;
using namespace Aspose::Slides::Export;

auto presentation = System::MakeObject<Presentation>();
auto slide = presentation->get_Slide(0);

auto chart = slide->get_Shapes()->AddChart(ChartType::ClusteredColumn, 50, 50, 450, 300);
chart->get_Axes()->get_VerticalAxis()->set_DisplayUnit(DisplayUnitType::Millions);

presentation->Save(u"Result.pptx", SaveFormat::Pptx);
คำถามที่พบบ่อย
ฉันจะตั้งค่าจุดที่แกนหนึ่งข้ามแกนอื่น (การข้ามแกน) อย่างไร?
ใช้ set_CrossType เพื่อเลือกพฤติกรรมการข้าม. หากต้องการระบุค่าตัวเลขของจุดที่ข้าม, ใช้ set_CrossAt. การตั้งค่าเหล่านี้ช่วยให้คุณย้ายจุดที่แกนข้ามไปยังฐานที่เหมาะสม
ฉันจะวางตำแหน่งป้ายเครื่องหมายทิกสัมพันธ์กับแกนอย่างไร?
ใช้ set_TickLabelPosition พร้อมค่าจาก TickLabelPositionType: Low, High, NextTo, หรือ None. เพื่อควบคุมเครื่องหมายทิกเอง, ใช้ set_MajorTickMark หรือ set_MinorTickMark; สิ่งเหล่านี้แยกจากการวางตำแหน่งป้ายชื่อ