
จัดการชุดข้อมูลแผนภูมิในงานนำเสนอด้วย C++
ภาพรวม
แผนภูมิจัดเก็บข้อมูลที่พล็อตไว้ในสมุดงานข้อมูลแผนภูมิ. IChartSeries แทนชุดค่าที่เกี่ยวข้องหนึ่งชุด, และแต่ละ IChartDataPoint ในชุดข้อมูลอ้างอิงถึงหนึ่งหรือหลายเซลของสมุดงาน. IChartCategory ให้ป้ายกำกับหรือค่า grouping ที่ใช้ร่วมกันโดยชุดข้อมูล. ชื่อชุดข้อมูล, หมวดหมู่, และค่าจุดจึงเชื่อมต่อกับ IChartDataCell แทนที่จะถูกเก็บเป็นข้อความที่แสดงเท่านั้น.
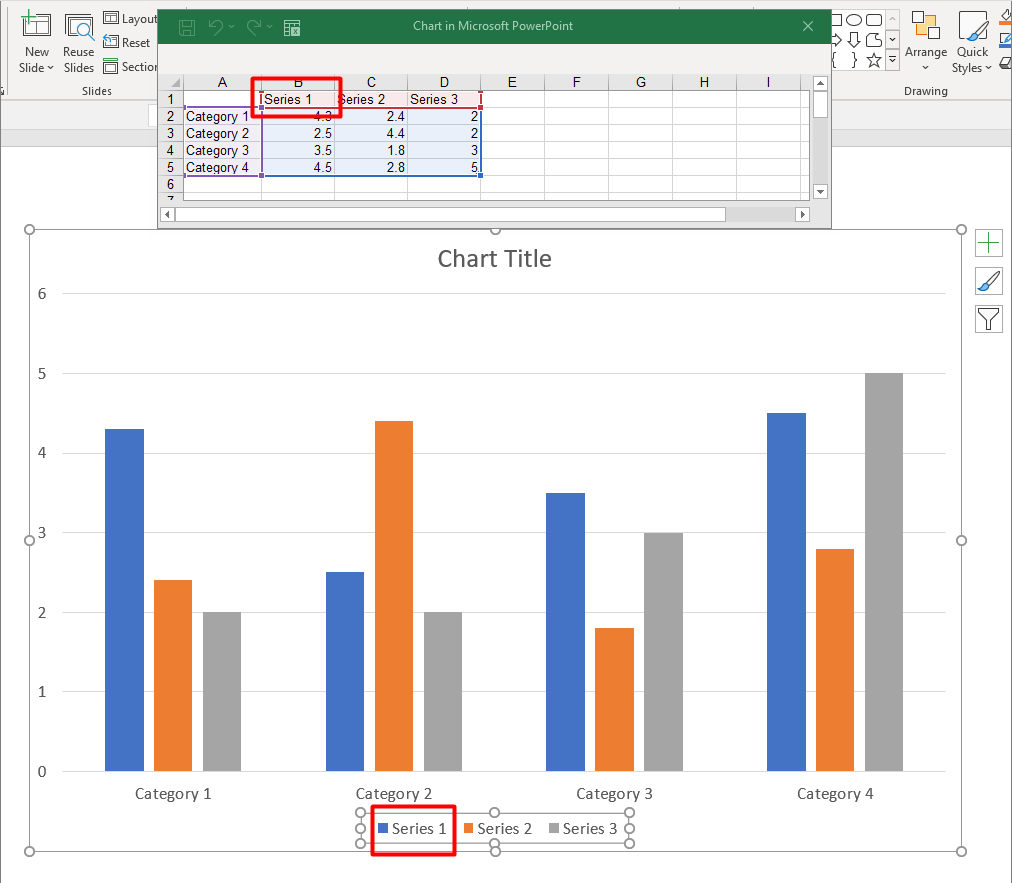
สำหรับแผนภูมิกลุ่มประเภททั่วไป, สมุดงานค่าเริ่มต้นใช้แถว 0 สำหรับชื่อชุดข้อมูล, คอลัมน์ 0 สำหรับชื่อหมวดหมู่, ส่วนเซลที่เหลือสำหรับค่าชุดข้อมูล. ดัชนีของ Worksheet, แถว, และคอลัมน์ที่ส่งไปยัง IChartDataWorkbook::GetCell เริ่มต้นจากศูนย์. การจัดวางนี้มีประโยชน์เมื่อคุณสร้างแผนภูมิกับข้อมูลเริ่มต้น, แต่ไม่ควรสันนิษฐานว่าแผนภูมิที่มีอยู่ทั้งหมดใช้วิธีนี้. สำหรับการนำเสนอที่โหลดแล้ว, ตรวจสอบเซลที่ชุดข้อมูล, หมวดหมู่, และจุดข้อมูลอ้างอิงก่อนที่จะเปลี่ยนค่าในสมุดงาน.
การตั้งค่าแผนภูมิมีสามระดับ:
- การตั้งค่าระดับชุดข้อมูล, เช่น IChartSeries::get_Format, ให้ลักษณะการแสดงผลเริ่มต้นสำหรับทุกจุดในชุดเดียว.
- การตั้งค่าจุดข้อมูล, เช่น IChartDataPoint::get_Format, ครอบคลุมการแสดงผลของชุดข้อมูลสำหรับจุดเดียว.
- การตั้งค่ากลุ่มใช้กับชุดข้อมูลที่เข้ากันซึ่งอยู่ใน IChartSeriesGroup เดียวกัน. เข้าถึงกลุ่มผ่าน IChartSeries::get_ParentSeriesGroup เมื่อคุณต้องการตั้งค่าตัวเลือกเช่นการทับหรือความกว้างช่องว่าง.
เมื่อไม่มีการกำหนดการเติมสีจุดหรือชุดข้อมูลอย่างชัดเจน, สไตล์และธีมของแผนภูมิกำหนดลักษณะอัตโนมัติ. เมื่อมีการกำหนดรูปแบบทั้งชุดข้อมูลและจุด, การกำหนดรูปแบบจุดจะมีลำดับความสำคัญสำหรับจุดนั้น.
ตั้งค่าการทับของชุดข้อมูลในแผนภูมิ
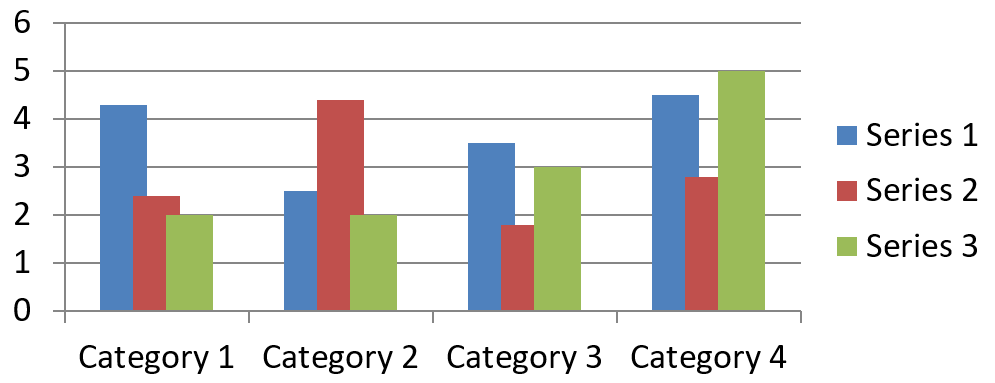
IChartSeries::get_Overlap รายงานว่าบาร์หรือคอลัมน์ทับกันเท่าใดในแผนภูมิ 2D, ตั้งแต่ -100 ถึง 100 เปอร์เซ็นต์. มันเป็นการฉายภาพแบบอ่านอย่างเดียวของการตั้งค่าบนกลุ่มชุดข้อมูลหลัก. เรียก IChartSeriesGroup::set_Overlap เพื่ออัปเดตทุกชุดข้อมูลที่เข้ากันในกลุ่มนั้น. ตัวเลือกนี้ใช้กับประเภทแผนภูมิที่แสดงบาร์หรือคอลัมน์เป็นกลุ่ม; มันไม่ส่งผลต่อกลุ่มชุดข้อมูลที่ไม่เกี่ยวข้องในแผนภูมิกลุ่ม.
ตัวอย่างต่อไปนี้ตั้งค่าการทับสำหรับกลุ่มที่มีชุดแรกอยู่ในนั้น:
#include <cstdint>
#include <DOM/Chart/ChartType.h>
#include <DOM/Chart/IChartData.h>
#include <DOM/Chart/IChartSeries.h>
#include <DOM/Chart/IChartSeriesCollection.h>
#include <DOM/Chart/IChartSeriesGroup.h>
#include <DOM/IChart.h>
#include <DOM/IShapeCollection.h>
#include <DOM/ISlide.h>
#include <DOM/Presentation.h>
#include <Export/SaveFormat.h>
#include <system/shared_ptr.h>

using Aspose::Slides::Charts::ChartType;
using Aspose::Slides::Export::SaveFormat;
using Aspose::Slides::Presentation;

const int firstSlideIndex = 0;
const int firstSeriesIndex = 0;
const int8_t overlapPercent = 30;

auto presentation = System::MakeObject<Presentation>();
auto slide = presentation->get_Slide(firstSlideIndex);

// แผนภูมิใหม่มีชุดข้อมูลตัวอย่าง, หมวดหมู่, และค่า.
auto chart = slide->get_Shapes()->AddChart(ChartType::ClusteredColumn, 20.0f, 20.0f, 500.0f, 200.0f);

auto seriesCollection = chart->get_ChartData()->get_Series();
auto series = seriesCollection->idx_get(firstSeriesIndex);
series->get_ParentSeriesGroup()->set_Overlap(overlapPercent);

presentation->Save(u"series_overlap.pptx", SaveFormat::Pptx);
presentation->Dispose();
ผลลัพธ์:
เปลี่ยนสีเติมของชุดข้อมูล
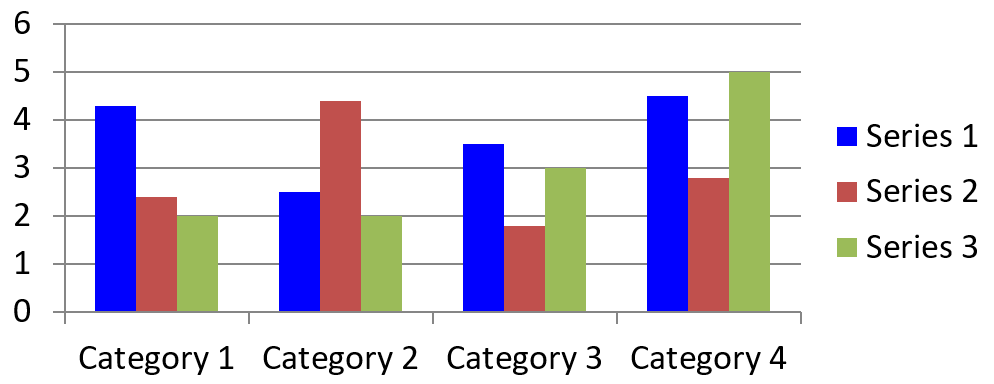
ใช้ IChartSeries::get_Format เพื่อตั้งค่าสีเติมเริ่มต้นสำหรับทั้งชุดข้อมูล. หากจุดมีการเติมสีที่กำหนดไว้แล้ว, การตั้งค่า IChartDataPoint::get_Format จะครอบคลุมการเติมสีของชุดข้อมูลสำหรับจุดนั้น.
ตัวอย่างต่อไปนี้ใช้สีเติมลำดับฟ้าตรงสำหรับชุดแรก:
#include <DOM/Chart/ChartType.h>
#include <DOM/Chart/IChartData.h>
#include <DOM/Chart/IChartSeries.h>
#include <DOM/Chart/IChartSeriesCollection.h>
#include <DOM/Chart/IFormat.h>
#include <DOM/FillType.h>
#include <DOM/IChart.h>
#include <DOM/IColorFormat.h>
#include <DOM/IFillFormat.h>
#include <DOM/IShapeCollection.h>
#include <DOM/ISlide.h>
#include <DOM/Presentation.h>
#include <Export/SaveFormat.h>
#include <drawing/color.h>
#include <system/shared_ptr.h>

using Aspose::Slides::Charts::ChartType;
using Aspose::Slides::Export::SaveFormat;
using Aspose::Slides::FillType;
using Aspose::Slides::Presentation;
using System::Drawing::Color;

const int firstSlideIndex = 0;
const int firstSeriesIndex = 0;

auto presentation = System::MakeObject<Presentation>();
auto slide = presentation->get_Slide(firstSlideIndex);

auto chart = slide->get_Shapes()->AddChart(ChartType::ClusteredColumn, 20.0f, 20.0f, 500.0f, 200.0f);

auto seriesCollection = chart->get_ChartData()->get_Series();
auto series = seriesCollection->idx_get(firstSeriesIndex);
auto seriesColor = Color::get_Blue();
series->get_Format()->get_Fill()->set_FillType(FillType::Solid);
series->get_Format()->get_Fill()->get_SolidFillColor()->set_Color(seriesColor);

presentation->Save(u"series_color.pptx", SaveFormat::Pptx);
presentation->Dispose();
ผลลัพธ์:
เปลี่ยนชื่อชุดข้อมูล
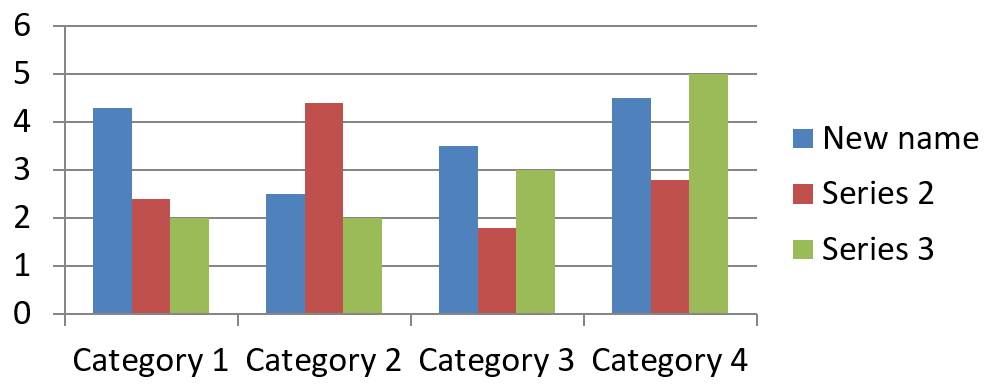
ชื่อชุดข้อมูลถูกเก็บในสมุดงานข้อมูลแผนภูมิและโดยปกติจะแสดงใน легенда. ในสมุดงานเริ่มต้นที่สร้างสำหรับแผนภูมิคอลัมน์แบบกลุ่ม, เซล B1 อยู่ที่แถว 0, คอลัมน์ 1 และมีชื่อของชุดแรก. ค่าคงที่ที่ตั้งชื่อไว้ในตัวอย่างต่อไปนี้ทำให้โครงสร้างนี้ชัดเจน:
#include <DOM/Chart/ChartType.h>
#include <DOM/Chart/IChartData.h>
#include <DOM/Chart/IChartDataCell.h>
#include <DOM/Chart/IChartDataWorkbook.h>
#include <DOM/IChart.h>
#include <DOM/IShapeCollection.h>
#include <DOM/ISlide.h>
#include <DOM/Presentation.h>
#include <Export/SaveFormat.h>
#include <system/object_ext.h>
#include <system/shared_ptr.h>
#include <system/string.h>

using Aspose::Slides::Charts::ChartType;
using Aspose::Slides::Export::SaveFormat;
using Aspose::Slides::Presentation;
using System::ObjectExt;
using System::String;

const int firstSlideIndex = 0;
const int worksheetIndex = 0;
const int seriesNameRowIndex = 0;
const int firstSeriesColumnIndex = 1;

auto presentation = System::MakeObject<Presentation>();
auto slide = presentation->get_Slide(firstSlideIndex);

auto chart = slide->get_Shapes()->AddChart(ChartType::ClusteredColumn, 20.0f, 20.0f, 500.0f, 200.0f);

auto workbook = chart->get_ChartData()->get_ChartDataWorkbook();
auto seriesNameCell = workbook->GetCell(worksheetIndex, seriesNameRowIndex, firstSeriesColumnIndex);
auto seriesName = ObjectExt::Box<String>(u"Revenue");
seriesNameCell->set_Value(seriesName);

presentation->Save(u"series_name.pptx", SaveFormat::Pptx);
presentation->Dispose();
คุณยังสามารถอัปเดตเซลที่อ้างอิงโดย IChartSeries::get_Name ได้. วิธีนี้หลีกเลี่ยงการสันนิษฐานว่าแผนภูมิที่มีอยู่มีแถวและคอลัมน์เฉพาะ:
#include <DOM/Chart/ChartType.h>
#include <DOM/Chart/IChartCellCollection.h>
#include <DOM/Chart/IChartData.h>
#include <DOM/Chart/IChartDataCell.h>
#include <DOM/Chart/IChartSeries.h>
#include <DOM/Chart/IChartSeriesCollection.h>
#include <DOM/Chart/IStringChartValue.h>
#include <DOM/IChart.h>
#include <DOM/IShapeCollection.h>
#include <DOM/ISlide.h>
#include <DOM/Presentation.h>
#include <Export/SaveFormat.h>
#include <system/object_ext.h>
#include <system/shared_ptr.h>
#include <system/string.h>

using Aspose::Slides::Charts::ChartType;
using Aspose::Slides::Export::SaveFormat;
using Aspose::Slides::Presentation;
using System::ObjectExt;
using System::String;

const int firstSlideIndex = 0;
const int firstSeriesIndex = 0;
const int firstNameCellIndex = 0;

auto presentation = System::MakeObject<Presentation>();
auto slide = presentation->get_Slide(firstSlideIndex);

auto chart = slide->get_Shapes()->AddChart(ChartType::ClusteredColumn, 20.0f, 20.0f, 500.0f, 200.0f);

auto seriesCollection = chart->get_ChartData()->get_Series();
auto series = seriesCollection->idx_get(firstSeriesIndex);
auto seriesNameCells = series->get_Name()->get_AsCells();
auto seriesNameCell = seriesNameCells->idx_get(firstNameCellIndex);
auto seriesName = ObjectExt::Box<String>(u"Revenue");
seriesNameCell->set_Value(seriesName);

presentation->Save(u"series_name.pptx", SaveFormat::Pptx);
presentation->Dispose();
ผลลัพธ์:
สร้างชุดข้อมูลด้วยชื่อจากหลายเซล
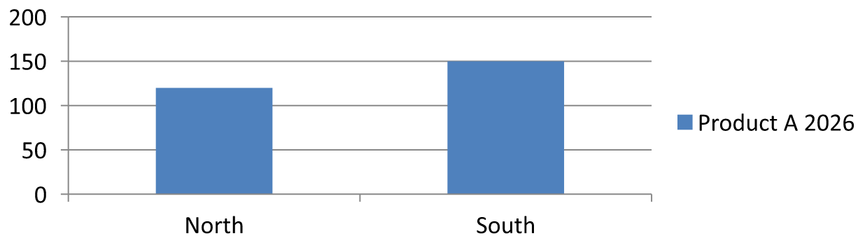
ชื่อชุดข้อมูลแบบผสมเป็นประโยชน์เมื่อชื่อผลิตภัณฑ์และช่วงเวลารายงานถูกเก็บในเซลสมุดงานแยกกัน. ตัวอย่างเช่น, คุณสามารถรวม Product A ใน B1 และ 2026 ใน C1 ให้เป็นชื่อชุดข้อมูลเดียวโดยยังคงเชื่อมโยงส่วนทั้งสองกับเซลต้นทางของพวกมัน.
ใช้ IChartDataWorkbook::GetCellCollection เพื่อดึงช่วงชื่อ, จากนั้นส่งคอลเลกชันนั้นไปยัง IChartSeriesCollection::Add. อากิวเมนต์ skipHiddenCells ควบคุมว่าจะรวมเซลที่ซ่อนอยู่หรือไม่: true จะแยกออก, false จะรวม. ตัวอย่างนี้ใช้ค่า false เพื่อรวมทุกเซลในช่วงชื่อ.
ตัวอย่างต่อไปนี้สร้างการนำเสนอที่มีหนึ่งชุดข้อมูลและสองจุดข้อมูล. เซล B1:C1 ให้เฉพาะชื่อชุดข้อมูล; A2:A3 ให้ป้ายกำกับหมวดหมู่, และ B2:B3 ให้ค่าตัวเลข.
#include <DOM/Chart/ChartType.h>
#include <DOM/Chart/IChartCategoryCollection.h>
#include <DOM/Chart/IChartCellCollection.h>
#include <DOM/Chart/IChartData.h>
#include <DOM/Chart/IChartDataCell.h>
#include <DOM/Chart/IChartDataPointCollection.h>
#include <DOM/Chart/IChartDataWorkbook.h>
#include <DOM/Chart/IChartSeries.h>
#include <DOM/Chart/IChartSeriesCollection.h>
#include <DOM/IChart.h>
#include <DOM/IShapeCollection.h>
#include <DOM/ISlide.h>
#include <DOM/Presentation.h>
#include <Export/SaveFormat.h>
#include <system/object_ext.h>
#include <system/shared_ptr.h>
#include <system/string.h>

using namespace Aspose::Slides;
using namespace Aspose::Slides::Charts;
using namespace Aspose::Slides::Export;
using System::ObjectExt;
using System::String;

auto presentation = System::MakeObject<Presentation>();
auto slide = presentation->get_Slide(0);

auto chart = slide->get_Shapes()->AddChart(ChartType::ClusteredColumn, 50.0f, 50.0f, 620.0f, 180.0f);
auto chartData = chart->get_ChartData();

chartData->get_Series()->Clear();
chartData->get_Categories()->Clear();
chart->set_HasLegend(true);

auto workbook = chartData->get_ChartDataWorkbook();
workbook->Clear(0);

// เซลสองเซลนี้ให้ชื่อชุดข้อมูล.
auto productName = ObjectExt::Box<String>(u"Product A");
auto reportingPeriod = ObjectExt::Box<String>(u"2026");
workbook->GetCell(0, 0, 1, productName);
workbook->GetCell(0, 0, 2, reportingPeriod);
auto nameCells = workbook->GetCellCollection(u"Sheet1!$B$1:$C$1", false);
auto series = chartData->get_Series()->Add(nameCells, ChartType::ClusteredColumn);

// เซลแยกต่างหากให้หมวดหมู่และจุดข้อมูลเชิงตัวเลข.
auto northLabel = ObjectExt::Box<String>(u"North");
auto southLabel = ObjectExt::Box<String>(u"South");
auto northCategory = workbook->GetCell(0, 1, 0, northLabel);
auto southCategory = workbook->GetCell(0, 2, 0, southLabel);
chartData->get_Categories()->Add(northCategory);
chartData->get_Categories()->Add(southCategory);
auto northAmount = ObjectExt::Box<int>(120);
auto southAmount = ObjectExt::Box<int>(150);
auto northValue = workbook->GetCell(0, 1, 1, northAmount);
auto southValue = workbook->GetCell(0, 2, 1, southAmount);
series->get_DataPoints()->AddDataPointForBarSeries(northValue);
series->get_DataPoints()->AddDataPointForBarSeries(southValue);

presentation->Save(u"composite_series_name.pptx", SaveFormat::Pptx);
presentation->Dispose();
ชื่อชุดข้อมูลที่ได้คือ Product A 2026, มีช่องว่างระหว่างค่าจากสองเซล. легенда แสดงเป็นรายการเดียวสำหรับทั้งสองคอลัมน์. ภาพด้านล่างแสดงผลลัพธ์:
รับสีเติมอัตโนมัติของชุดข้อมูล
IChartSeries::GetAutomaticSeriesColor คืนค่าสีที่คำนวณจากดัชนีชุดข้อมูลและสไตล์ของแผนภูมิ. นี้คือสีที่ใช้เมื่อการเติมสีของชุดข้อมูลไม่ได้กำหนดอย่างชัดเจน. การเรียกเมธอดนี้อ่านค่าสีที่คำนวณ; ไม่ได้ตั้งค่าสีใหม่.
ตัวอย่างต่อไปนี้พิมพ์สีอัตโนมัติของแต่ละชุดข้อมูลเริ่มต้น:
#include <DOM/Chart/ChartType.h>
#include <DOM/Chart/IChartData.h>
#include <DOM/Chart/IChartSeries.h>
#include <DOM/Chart/IChartSeriesCollection.h>
#include <DOM/IChart.h>
#include <DOM/IShapeCollection.h>
#include <DOM/ISlide.h>
#include <DOM/Presentation.h>
#include <drawing/color.h>
#include <system/console.h>
#include <system/shared_ptr.h>
#include <system/string.h>

using Aspose::Slides::Charts::ChartType;
using Aspose::Slides::Presentation;
using System::Console;
using System::String;

const int firstSlideIndex = 0;

auto presentation = System::MakeObject<Presentation>();
auto slide = presentation->get_Slide(firstSlideIndex);

auto chart = slide->get_Shapes()->AddChart(ChartType::ClusteredColumn, 20.0f, 20.0f, 500.0f, 200.0f);

auto seriesCollection = chart->get_ChartData()->get_Series();
const int seriesCount = seriesCollection->get_Count();
for (int seriesIndex = 0; seriesIndex < seriesCount; seriesIndex++)
{
    auto series = seriesCollection->idx_get(seriesIndex);
    auto automaticColor = series->GetAutomaticSeriesColor();
    auto colorName = automaticColor.get_Name();
    auto outputLine = String::Format(u"Series {0}: {1}", seriesIndex, colorName);
    Console::WriteLine(outputLine);
}

presentation->Dispose();
ผลลัพธ์ตัวอย่างสำหรับสไตล์แผนภูมิปริยาย:
Series 0: ff4f81bd
Series 1: ffc0504d
Series 2: ff9bbb59
สีที่ได้ขึ้นอยู่กับสไตล์และธีมของแผนภูมิ.
ตั้งค่าสีเติมแบบกลับด้านสำหรับชุดข้อมูลในแผนภูมิ
สำหรับชุดข้อมูลบาร์, คอลัมน์, และบับเบิล, IChartSeries::set_InvertIfNegative สามารถแสดงค่าติดลบด้วยสีเติมที่แตกต่าง. ตั้งค่าการเติมสีของชุดข้อมูลเป็นสีทึบ, เปิดการกลับด้าน, แล้วกำหนดสีค่าติดลบผ่าน IChartSeries::get_InvertedSolidFillColor. จำนวนลบจะไม่เปลี่ยนในสมุดงาน; เพียงสีการแสดงผลเท่านั้นที่เปลี่ยน.
ตัวอย่างต่อไปนี้แทนที่ข้อมูลแผนภูมิเริ่มต้นด้วยชุดข้อมูลหนึ่งชุด. แถว 0 ของ Worksheet มีชื่อชุดข้อมูล, คอลัมน์ 0 มีชื่อหมวดหมู่, และคอลัมน์ 1 มีค่า:
#include <DOM/Chart/ChartType.h>
#include <DOM/Chart/IChartCategoryCollection.h>
#include <DOM/Chart/IChartData.h>
#include <DOM/Chart/IChartDataCell.h>
#include <DOM/Chart/IChartDataPointCollection.h>
#include <DOM/Chart/IChartDataWorkbook.h>
#include <DOM/Chart/IChartSeries.h>
#include <DOM/Chart/IChartSeriesCollection.h>
#include <DOM/Chart/IFormat.h>
#include <DOM/FillType.h>
#include <DOM/IChart.h>
#include <DOM/IColorFormat.h>
#include <DOM/IFillFormat.h>
#include <DOM/IShapeCollection.h>
#include <DOM/ISlide.h>
#include <DOM/Presentation.h>
#include <Export/SaveFormat.h>
#include <drawing/color.h>
#include <system/object_ext.h>
#include <system/shared_ptr.h>
#include <system/string.h>

using Aspose::Slides::Charts::ChartType;
using Aspose::Slides::Export::SaveFormat;
using Aspose::Slides::FillType;
using Aspose::Slides::Presentation;
using System::Drawing::Color;
using System::ObjectExt;
using System::String;

const int firstSlideIndex = 0;
const int worksheetIndex = 0;
const int headerRowIndex = 0;
const int categoryColumnIndex = 0;
const int firstSeriesColumnIndex = 1;
const int firstDataRowIndex = 1;
const int categoryCount = 3;

const String categoryNames[] = {u"Category 1", u"Category 2", u"Category 3"};
const int seriesValues[] = {-20, 50, -30};

auto presentation = System::MakeObject<Presentation>();
auto slide = presentation->get_Slide(firstSlideIndex);

auto chart = slide->get_Shapes()->AddChart(ChartType::ClusteredColumn, 20.0f, 20.0f, 500.0f, 200.0f);
auto chartData = chart->get_ChartData();
auto workbook = chartData->get_ChartDataWorkbook();

auto seriesCollection = chartData->get_Series();
seriesCollection->Clear();
chartData->get_Categories()->Clear();

auto seriesName = ObjectExt::Box<String>(u"Series 1");
auto seriesNameCell = workbook->GetCell(worksheetIndex, headerRowIndex, firstSeriesColumnIndex, seriesName);
auto chartType = chart->get_Type();
auto series = seriesCollection->Add(seriesNameCell, chartType);

for (int categoryIndex = 0; categoryIndex < categoryCount; categoryIndex++)
{
    const int dataRowIndex = firstDataRowIndex + categoryIndex;
    auto categoryName = categoryNames[categoryIndex];
    const int seriesValue = seriesValues[categoryIndex];

    auto boxedCategoryName = ObjectExt::Box<String>(categoryName);
    auto categoryCell = workbook->GetCell(worksheetIndex, dataRowIndex, categoryColumnIndex, boxedCategoryName);
    chartData->get_Categories()->Add(categoryCell);

    auto boxedSeriesValue = ObjectExt::Box<int>(seriesValue);
    auto valueCell = workbook->GetCell(worksheetIndex, dataRowIndex, firstSeriesColumnIndex, boxedSeriesValue);
    series->get_DataPoints()->AddDataPointForBarSeries(valueCell);
}

auto automaticSeriesColor = series->GetAutomaticSeriesColor();
auto invertedSeriesColor = Color::get_Red();
series->get_Format()->get_Fill()->set_FillType(FillType::Solid);
series->get_Format()->get_Fill()->get_SolidFillColor()->set_Color(automaticSeriesColor);
series->set_InvertIfNegative(true);
series->get_InvertedSolidFillColor()->set_Color(invertedSeriesColor);

presentation->Save(u"inverted_solid_fill_color.pptx", SaveFormat::Pptx);
presentation->Dispose();
ผลลัพธ์:

คุณสามารถเปิดการกลับด้านสำหรับจุดเดียวผ่าน IChartDataPoint::set_InvertIfNegative. ในตัวอย่างต่อไปนี้ การกลับด้านถูกปิดสำหรับชุดข้อมูลและเปิดเฉพาะจุดที่เลือก. จุดนั้นยังถูกกำหนดค่าเป็นค่าติดลบเพื่อให้เห็นผล:
#include <DOM/Chart/ChartType.h>
#include <DOM/Chart/IChartData.h>
#include <DOM/Chart/IChartDataCell.h>
#include <DOM/Chart/IChartDataPoint.h>
#include <DOM/Chart/IChartSeries.h>
#include <DOM/Chart/IChartSeriesCollection.h>
#include <DOM/Chart/IDoubleChartValue.h>
#include <DOM/Chart/IFormat.h>
#include <DOM/FillType.h>
#include <DOM/IChart.h>
#include <DOM/IColorFormat.h>
#include <DOM/IFillFormat.h>
#include <DOM/IShapeCollection.h>
#include <DOM/ISlide.h>
#include <DOM/Presentation.h>
#include <Export/SaveFormat.h>
#include <drawing/color.h>
#include <system/object_ext.h>
#include <system/shared_ptr.h>

using Aspose::Slides::Charts::ChartType;
using Aspose::Slides::Export::SaveFormat;
using Aspose::Slides::FillType;
using Aspose::Slides::Presentation;
using System::Drawing::Color;
using System::ObjectExt;

const int firstSlideIndex = 0;
const int firstSeriesIndex = 0;
const int targetDataPointIndex = 2;
const int negativeValue = -30;

auto presentation = System::MakeObject<Presentation>();
auto slide = presentation->get_Slide(firstSlideIndex);

auto chart = slide->get_Shapes()->AddChart(ChartType::ClusteredColumn, 20.0f, 20.0f, 500.0f, 200.0f);

auto seriesCollection = chart->get_ChartData()->get_Series();
auto series = seriesCollection->idx_get(firstSeriesIndex);
auto automaticSeriesColor = series->GetAutomaticSeriesColor();
auto invertedSeriesColor = Color::get_Red();
series->get_Format()->get_Fill()->set_FillType(FillType::Solid);
series->get_Format()->get_Fill()->get_SolidFillColor()->set_Color(automaticSeriesColor);
series->get_InvertedSolidFillColor()->set_Color(invertedSeriesColor);
series->set_InvertIfNegative(false);

auto dataPoint = series->get_DataPoint(targetDataPointIndex);
auto boxedNegativeValue = ObjectExt::Box<int>(negativeValue);
dataPoint->get_YValue()->get_AsCell()->set_Value(boxedNegativeValue);
dataPoint->set_InvertIfNegative(true);

presentation->Save(u"data_point_invert_color_if_negative.pptx", SaveFormat::Pptx);
presentation->Dispose();
ลบค่าจุดข้อมูลเฉพาะ
เพื่อทำให้จุดหนึ่งเป็นค่าว่างโดยไม่ลบจุดอื่น, ตั้งค่าเซลในสมุดงานที่สนับสนุนเป็น nullptr. สำหรับแผนภูมิคอลัมน์, ค่าที่พล็อตได้สามารถเข้าถึงผ่าน IChartDataPoint::get_YValue. จุดข้อมูลยังคงอยู่ที่ตำแหน่งหมวดหมู่เดิม, แต่แผนภูมิจัดการค่าของมันเป็นค่าว่างตามการตั้งค่าค่าว่างของแผนภูมิ.
ตัวอย่างต่อไปนี้ลบเฉพาะจุดที่สองในชุดแรก:
#include <DOM/Chart/ChartType.h>
#include <DOM/Chart/IChartData.h>
#include <DOM/Chart/IChartDataCell.h>
#include <DOM/Chart/IChartDataPoint.h>
#include <DOM/Chart/IChartSeries.h>
#include <DOM/Chart/IChartSeriesCollection.h>
#include <DOM/Chart/IDoubleChartValue.h>
#include <DOM/IChart.h>
#include <DOM/IShapeCollection.h>
#include <DOM/ISlide.h>
#include <DOM/Presentation.h>
#include <Export/SaveFormat.h>
#include <system/shared_ptr.h>

using Aspose::Slides::Charts::ChartType;
using Aspose::Slides::Export::SaveFormat;
using Aspose::Slides::Presentation;

const int firstSlideIndex = 0;
const int firstSeriesIndex = 0;
const int targetDataPointIndex = 1;

auto presentation = System::MakeObject<Presentation>();
auto slide = presentation->get_Slide(firstSlideIndex);

auto chart = slide->get_Shapes()->AddChart(ChartType::ClusteredColumn, 20.0f, 20.0f, 500.0f, 200.0f);

auto seriesCollection = chart->get_ChartData()->get_Series();
auto series = seriesCollection->idx_get(firstSeriesIndex);
auto dataPoint = series->get_DataPoint(targetDataPointIndex);
dataPoint->get_YValue()->get_AsCell()->set_Value(nullptr);

presentation->Save(u"clear_data_point_value.pptx", SaveFormat::Pptx);
presentation->Dispose();
แผนภูมิกระจายใช้เซล X และ Y แยกกัน, และแผนภูมิบับเบิลยังใช้เซลขนาด. ให้ลบเฉพาะเซลที่แทนค่าที่ต้องการลบ. อย่าเรียก IChartDataPointCollection::Clear เมื่อคุณต้องการเก็บจุดอื่นไว้, เนื่องจากเมธอดนั้นลบทุกจุดในคอลเลกชัน.
ควบคุมการแสดงผลของเซลที่ว่าง
เซลที่ซ่อนอยู่และมีค่าเป็นกรณีแยกจากเซลที่ว่าง. เพื่อรวมหรือแยกข้อมูลจากแถวและคอลัมน์ที่ซ่อนอยู่ใน Worksheet, ดูที่ Include Data from Hidden Rows and Columns.
เซลสมุดงานที่ว่างแสดงว่าข้อมูลหาย; เซลที่มีค่า 0 แสดงว่ามีค่าตัวเลขที่รู้. เรียก IChartDataCell::set_Value ด้วย nullptr เพื่อทำให้เซลเป็นค่าว่าง. ศูนย์ตัวเลขยังคงเป็นศูนย์ไม่ว่าการตั้งค่าเซลว่างจะเป็นอย่างไร.
ใช้ IChart::set_DisplayBlanksAs เพื่อเลือกวิธีที่แผนภูมิจัดแสดงเซลที่ว่าง. การตั้งค่านี้ใช้กับแผนภูมิทั้งหมด. มันเปลี่ยนวิธีที่จุดว่างถูกพล็อต, โดยไม่ต้องเติมเซลว่างด้วยศูนย์หรือค่าประมาณ.
ตัวอย่างต่อไปนี้สร้างแผนภูมิเส้นที่มีชุดข้อมูลหนึ่ง, ลบค่าของ Day 3, แล้วบันทึกแผนภูมิกับแต่ละโหมด. ไม่ต้องใช้ไฟล์อินพุต. IChartDataWorkbook ใช้ Worksheet 0, คอลัมน์ 0 สำหรับป้ายหมวดหมู่, และคอลัมน์ 1 สำหรับค่า; แถว 0 มีชื่อชุดข้อมูล. ข้อมูลสุดท้ายคือ 10, 20, empty, 30, 40.
#include <array>
#include <DOM/Chart/ChartType.h>
#include <DOM/Chart/DisplayBlanksAsType.h>
#include <DOM/Chart/IChartCategoryCollection.h>
#include <DOM/Chart/IChartData.h>
#include <DOM/Chart/IChartDataCell.h>
#include <DOM/Chart/IChartDataPointCollection.h>
#include <DOM/Chart/IChartDataWorkbook.h>
#include <DOM/Chart/IChartSeries.h>
#include <DOM/Chart/IChartSeriesCollection.h>
#include <DOM/IChart.h>
#include <DOM/IShapeCollection.h>
#include <DOM/ISlide.h>
#include <DOM/Presentation.h>
#include <Export/SaveFormat.h>
#include <system/object_ext.h>
#include <system/shared_ptr.h>
#include <system/string.h>

using namespace Aspose::Slides;
using namespace Aspose::Slides::Charts;
using namespace Aspose::Slides::Export;
using System::ObjectExt;
using System::String;

auto presentation = System::MakeObject<Presentation>();
auto slide = presentation->get_Slide(0);

auto chart = slide->get_Shapes()->AddChart(ChartType::LineWithMarkers, 40.0f, 40.0f, 640.0f, 400.0f);
auto chartData = chart->get_ChartData();
auto workbook = chartData->get_ChartDataWorkbook();

chartData->get_Series()->Clear();
chartData->get_Categories()->Clear();

auto seriesName = ObjectExt::Box<String>(u"Measurements");
auto seriesNameCell = workbook->GetCell(0, 0, 1, seriesName);
auto series = chartData->get_Series()->Add(seriesNameCell, chart->get_Type());
auto values = std::array<int, 5>{10, 20, 25, 30, 40};

for (auto i = 0; i < values.size(); i++)
{
    auto categoryName = String::Format(u"Day {0}", i + 1);
    auto boxedCategoryName = ObjectExt::Box<String>(categoryName);
    auto categoryCell = workbook->GetCell(0, i + 1, 0, boxedCategoryName);
    chartData->get_Categories()->Add(categoryCell);
    auto boxedValue = ObjectExt::Box<int>(values[i]);
    auto valueCell = workbook->GetCell(0, i + 1, 1, boxedValue);
    series->get_DataPoints()->AddDataPointForLineSeries(valueCell);
}

// เว้น Day 3 ให้ว่างจริง ๆ ขณะยังคงหมวดหมู่และจุดข้อมูลของมัน.
workbook->GetCell(0, 3, 1)->set_Value(nullptr);

auto modes = std::array<DisplayBlanksAsType, 3>{DisplayBlanksAsType::Gap, DisplayBlanksAsType::Zero, DisplayBlanksAsType::Span};
for (auto mode : modes)
{
    chart->set_DisplayBlanksAs(mode);
    auto outputPath = String::Format(u"empty_cells_{0}.pptx", mode);
    presentation->Save(outputPath, SaveFormat::Pptx);
}

presentation->Dispose();
แต่ละไฟล์ผลลัพธ์บันทึกโหมดที่กำหนดก่อนบันทึก: empty_cells_Gap.pptx, empty_cells_Zero.pptx, และ empty_cells_Span.pptx. เพื่อบันทึกเวอร์ชันเดียว, ตั้งค่าโหมดที่ต้องการแล้วบันทึกการนำเสนอครั้งเดียวแทนการวนลูปผ่านทุกโหมด.
การเปรียบเทียบด้านล่างแสดงข้อมูลเดียวกันในทุกไฟล์. Day 3 เป็นค่าว่างในสมุดงานในทุกกรณี:
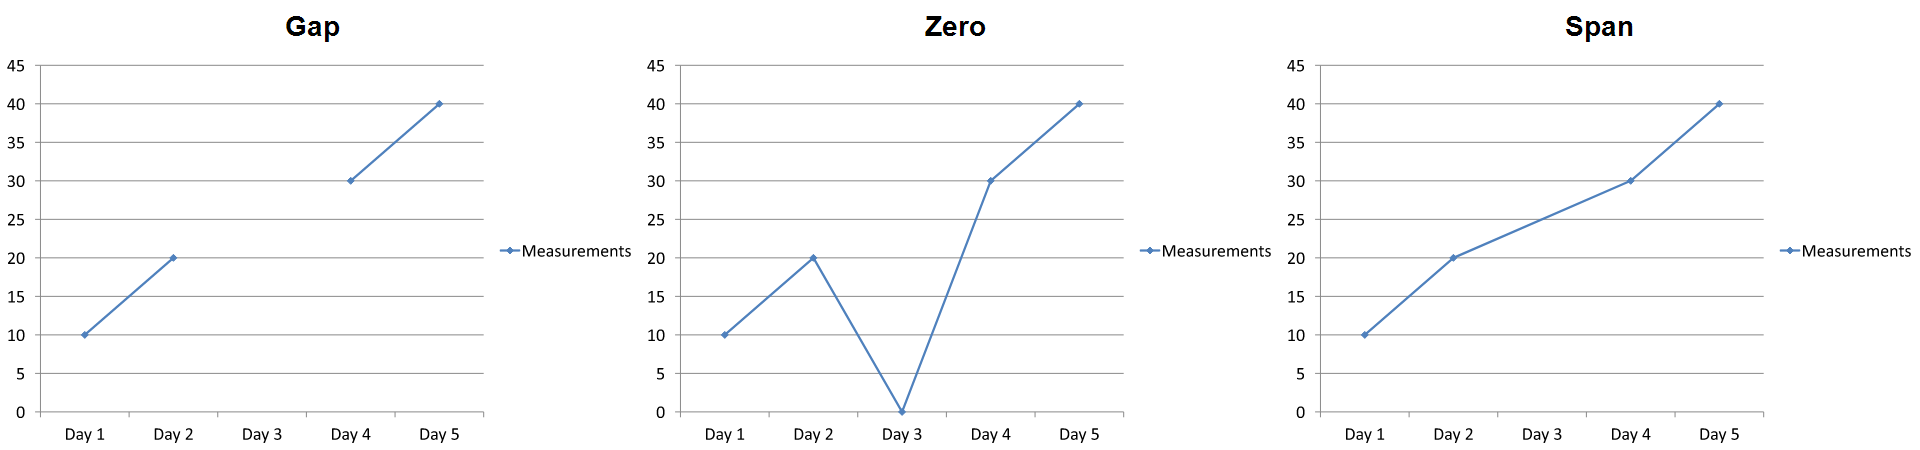
ผลกระทบที่มองเห็นขึ้นอยู่กับประเภทของแผนภูมิ. แผนภูมิเส้นทำให้เปรียบเทียบทุกโหมดได้ง่าย. แผนภูมิแท่งและคอลัมน์ไม่มีเส้นเชื่อมต่อผ่านหมวดหมู่ที่หายไป, ดังนั้น Span ไม่สามารถสร้างส่วนเชื่อมต่อที่แสดงด้านบน; คอลัมน์ที่หายไปและคอลัมน์สูงศูนย์อาจดูคล้ายกัน. เช่นเดียวกับแผนภูมิกระจายที่มีเครื่องหมายเท่านั้นไม่มีเส้นเชื่อมต่อ. อย่าคาดหวังผลลัพธ์ที่แตกต่างสามแบบสำหรับทุกประเภทแผนภูมิ; ตรวจสอบผลลัพธ์สำหรับประเภทที่คุณใช้.
ตั้งค่าความกว้างช่องว่างของชุดข้อมูล
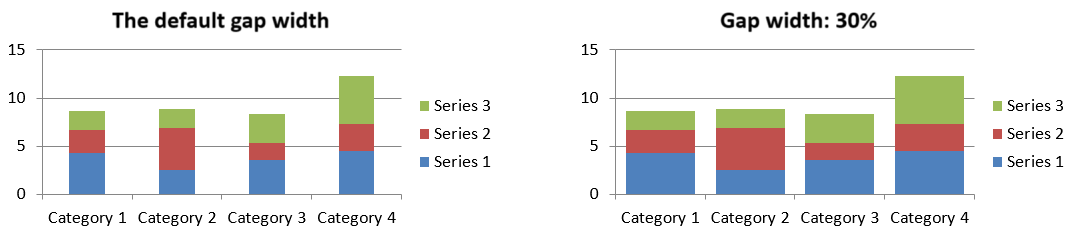
ความกว้างช่องว่างคือช่องว่างระหว่างกลุ่มบาร์หรือคอลัมน์ที่อยู่ติดกัน, แสดงเป็นเปอร์เซ็นต์ของความกว้างบาร์หรือคอลัมน์. เช่นเดียวกับการทับ, มันเป็นของกลุ่มชุดข้อมูลหลัก ไม่ใช่ของชุดข้อมูลเดียว. เรียก IChartSeriesGroup::set_GapWidth ครั้งเดียวสำหรับกลุ่ม. ค่าที่ใหญ่ขึ้นทำให้มีช่องว่างระหว่างกลุ่มมากขึ้น; ค่าที่เล็กลงทำให้กลุ่มหนาแน่นกว่า.
ตัวอย่างต่อไปนี้เปลี่ยนความกว้างช่องว่างและบันทึกเฉพาะการนำเสนอสุดท้าย:
#include <cstdint>
#include <DOM/Chart/ChartType.h>
#include <DOM/Chart/IChartData.h>
#include <DOM/Chart/IChartSeries.h>
#include <DOM/Chart/IChartSeriesCollection.h>
#include <DOM/Chart/IChartSeriesGroup.h>
#include <DOM/IChart.h>
#include <DOM/IShapeCollection.h>
#include <DOM/ISlide.h>
#include <DOM/Presentation.h>
#include <Export/SaveFormat.h>
#include <system/shared_ptr.h>

using Aspose::Slides::Charts::ChartType;
using Aspose::Slides::Export::SaveFormat;
using Aspose::Slides::Presentation;

const int firstSlideIndex = 0;
const int firstSeriesIndex = 0;
const uint16_t gapWidthPercent = 30;

auto presentation = System::MakeObject<Presentation>();
auto slide = presentation->get_Slide(firstSlideIndex);

auto chart = slide->get_Shapes()->AddChart(ChartType::StackedColumn, 20.0f, 20.0f, 500.0f, 200.0f);

auto seriesCollection = chart->get_ChartData()->get_Series();
auto series = seriesCollection->idx_get(firstSeriesIndex);
series->get_ParentSeriesGroup()->set_GapWidth(gapWidthPercent);

presentation->Save(u"gap_width_30.pptx", SaveFormat::Pptx);
presentation->Dispose();
ผลลัพธ์:
FAQ
ประเภทแผนภูมิใดบ้างที่รองรับชุดข้อมูล?
ทุกประเภทแผนภูมิที่ระบุใน enumeration ChartType ใช้ข้อมูลแผนภูมิ, แต่ชุดข้อมูลของพวกมันไม่จำเป็นต้องมีโครงสร้างค่าหรือการตั้งค่าเดียวกัน. ตัวอย่างเช่น, แผนภูมิกลุ่มใช้หมวดหมู่และค่า, แผนภูมิกระจายใช้ค่า X และ Y, และแผนภูมิบับเบิลเพิ่มขนาดบับเบิล. ใช้วิธีการสร้างจุดข้อมูลที่ตรงกับประเภทชุดข้อมูล. ตัวเลือกเช่นการทับและความกว้างช่องว่างใช้ได้กับกลุ่มบาร์หรือคอลัมน์ที่เข้ากันเท่านั้น.
ชุดข้อมูลกลุ่มคืออะไร?
IChartSeriesGroup มีชุดข้อมูลที่เข้ากันและใช้การตั้งค่าการพล็อตระดับกลุ่ม. แผนภูมิกลุ่มอาจมีมากกว่าหนึ่งกลุ่ม, ดังนั้นการเปลี่ยนกลุ่มผ่านชุดข้อมูลหนึ่งอาจไม่ได้เปลี่ยนทุกชุดข้อมูลในแผนภูมิ.
แผนภูมิที่สร้างใหม่มีข้อมูลเริ่มต้นหรือไม่?
มี. ตามค่าเริ่มต้น, IShapeCollection::AddChart สร้างชุดตัวอย่าง, หมวดหมู่, และค่า. คุณสามารถแก้ไขเซลเหล่านั้นหรือเคลียร์ทั้งชุดและคอลเลกชันหมวดหมู่ก่อนเพิ่มชุดข้อมูลที่กำหนดเองอย่างสมบูรณ์. การโอเวอร์โหลดบางอย่างยังสามารถสร้างแผนภูมิโดยไม่มีข้อมูลเริ่มต้น.
แผนภูมือต่อเชื่อมกับเซลในสมุดงานอย่างไร?
ชื่อชุดข้อมูล, ป้ายหมวดหมู่, และค่าจุดข้อมูลอ้างอิงเซลใน IChartDataWorkbook. การเปลี่ยนเซลที่อ้างอิงจะอัปเดตองค์ประกอบแผนภูมิเกี่ยวข้อง. เมื่อคุณสร้างข้อมูลแบบกำหนดเอง, ให้แถวหมวดหมู่และแถวค่าชุดข้อมูลเรียงตัวกันเพื่อให้แต่ละจุดพล็อตภายใต้หมวดหมู่ที่ตั้งใจ.
ฉันจะลบจุดเดียวแทนการลบทั้งชุดได้อย่างไร?
ตั้งค่าเซลค่าที่เกี่ยวข้องเป็น nullptr เพื่อรักษาตำแหน่งหมวดหมู่ของจุดเป็นจุดว่าง. เรียก IChartDataPointCollection::Clear เฉพาะเมื่อคุณต้องการลบจุดทั้งหมดจากชุดนั้น. หากคุณลบหมวดหมู่ด้วย, ให้ปรับทุกชุดข้อมูลเพื่อให้ค่าของพวกมันยังคงสอดคล้องกับคอลเลกชันหมวดหมู่.
จุดว่างจะแสดงอย่างไร?
ผลลัพธ์ขึ้นอยู่กับประเภทแผนภูมิและ IChart::get_DisplayBlanksAs. แผนภูมิที่รองรับสามารถแสดงค่าว่างเป็นช่องว่าง, ค่าเป็นศูนย์, หรือโดยการเชื่อมจุดใกล้เคียง. เลือกการตั้งค่าที่สอดคล้องกับความหมายของข้อมูลที่หายไปในงานนำเสนอของคุณ. ดูที่ Control the Display of Empty Cells สำหรับตัวอย่างสมบูรณ์และการเปรียบเทียบภาพ.
ค่าติดลบจะถูกจัดรูปแบบอย่างไร?
สำหรับชุดข้อมูลบาร์, คอลัมน์, และบับเบิลที่รองรับ, เรียก IChartSeries::set_InvertIfNegative และกำหนดสีผ่าน IChartSeries::get_InvertedSolidFillColor. คุณสามารถครอบคลุมพฤติกรรมสำหรับจุดเดี่ยวด้วย IChartDataPoint::set_InvertIfNegative. วิธีเหล่านี้มีผลต่อการจัดรูปแบบ, ไม่ใช่ค่าตัวเลขที่เก็บไว้.
การจัดรูปแบบใดจะชนะเมื่อทั้งชุดและจุดถูกจัดรูปแบบ?
การจัดรูปแบบจุดข้อมูลโดยชัดเจนมีลำดับความสำคัญสำหรับจุดนั้น. จุดอื่น ๆ ยังคงใช้รูปแบบชุดข้อมูลที่กำหนดหรือ, หากชุดข้อมูลไม่มีการกำหนดรูปแบบ, ใช้สไตล์และธีมของแผนภูมิตามอัตโนมัติ. การตั้งค่ากลุ่มเช่นการทับและความกว้างช่องว่างควบคุมการจัดวางและไม่ใช่การทับระดับจุด.
มีขีดจำกัดจำนวนชุดข้อมูลที่แผนภูมิกำหนดหรือไม่?
Aspose.Slides ไม่ได้กำหนดขีดจำกัดจำนวนชุดข้อมูลแยกจากกัน. ในการปฏิบัติ, ข้อจำกัดมาจากข้อจำกัดของไฟล์นำเสนอ, หน่วยความจำที่ใช้ได้, เวลาเรนเดอร์, และความอ่านง่ายของแผนภูมิ.
ฉันควรทำอย่างไรเมื่อคอลัมน์ใกล้กันเกินไปหรือห่างกันเกินไป?
เรียก IChartSeriesGroup::set_GapWidth บนกลุ่มชุดข้อมูลหลักที่เหมาะสม. เพิ่มค่เพื่อขยายช่องว่างระหว่างกลุ่ม, หรือ ลดค่าเพื่อทำให้กลุ่มใกล้กันมากขึ้น.