
ปรับแต่งรูปทรงในงานนำเสนอด้วย Python
บทนำ
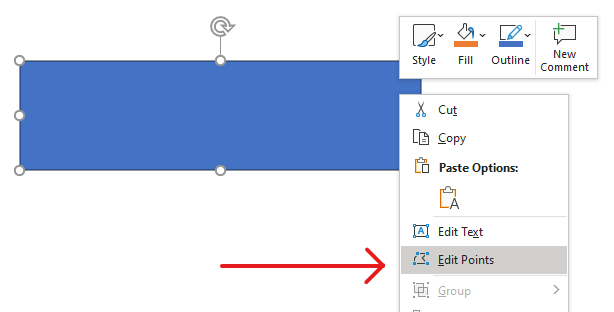
พิจารณาแปลงสี่เหลี่ยมจตุรัสหนึ่งรูป ใน PowerPoint ด้วย Edit Points คุณสามารถทำได้ว่า
- ย้ายมุมของแปลง inward หรือ outward,
- ปรับความโค้งของมุมหรือจุด,
- เพิ่มจุดใหม่ให้กับแปลง,
- จัดการจุดของมัน
คุณสามารถใช้การดำเนินการเหล่านี้กับรูปทรงใดก็ได้ ด้วย Edit Points คุณสามารถแก้ไขรูปทรงหรือสร้างรูปใหม่จากรูปที่มีอยู่
เคล็ดลับการแก้ไขรูปทรง
ก่อนที่คุณจะเริ่มแก้ไขรูปทรงใน PowerPoint ด้วย Edit Points ให้พิจารณาข้อควรจำต่อไปนี้เกี่ยวกับรูปทรง:
- รูปทรง (หรือเส้นทางของมัน) สามารถเป็น closed หรือ open ได้
- รูปแบบ closed ไม่มีจุดเริ่มต้นหรือจุดสิ้นสุด; รูปแบบ open มีจุดเริ่มต้นและจุดสิ้นสุด
- รูปทรงทุกรูปมีจุดเชื่อมติดตั้งอย่างน้อยสองจุดที่เชื่อมด้วยเส้นส่วน
- เส้นส่วนอาจเป็นเส้นตรงหรือโค้ง; จุดเชื่อมกำหนดลักษณะของเส้นส่วน
- จุดเชื่อมอาจเป็น corner, smooth, หรือ straight:
- จุด corner คือจุดที่เส้นตรงสองเส้นมาบรรจบกันเป็นมุม
- จุด smooth มีสองด้ามที่อยู่บนเส้นตรงเดียวกัน และเส้นส่วนที่เชื่อมต่อกันสร้างโค้งเรียบ ในกรณีนี้ด้ามทั้งสองอยู่ห่างจากจุดเชื่อมเท่ากัน
- จุด straight ก็มีสองด้ามที่อยู่บนเส้นตรงเดียวกัน แต่เส้นส่วนที่เชื่อมต่อกันสร้างโค้งเรียบ ในกรณีนี้ด้ามไม่จำเป็นต้องห่างจากจุดเชื่อมเท่ากัน
- โดยการย้ายหรือแก้ไขจุดเชื่อม (ซึ่งทำให้เปลี่ยนมุมของเส้นส่วน) คุณสามารถเปลี่ยนลักษณะของรูปทรงได้
เพื่อแก้ไขรูปทรงใน PowerPoint Aspose.Slides มีคลาส GeometryPath
- อินสแตนซ์ของ GeometryPath แทนเส้นทางเรขาคณิตของอ็อบเจกต์ GeometryShape
- เพื่อดึง GeometryPath จากอินสแตนซ์ของ GeometryShape ให้ใช้เมธอด GeometryShape.get_geometry_paths
- เพื่อกำหนด GeometryPath ให้กับรูปทรง ให้ใช้ GeometryShape.set_geometry_path สำหรับ solid shapes และ GeometryShape.set_geometry_paths สำหรับ composite shapes
- เพื่อเพิ่มเส้นส่วน ให้ใช้เมธอดบน GeometryPath
- ใช้คุณสมบัติ GeometryPath.stroke และ GeometryPath.fill_mode เพื่อควบคุมการแสดงผลของเส้นทางเรขาคณิต
- ใช้คุณสมบัติ GeometryPath.path_data เพื่อดึงเส้นทางเรขาคณิตของรูปทรงเป็นอาเรย์ของเส้นส่วน
การดำเนินการแก้ไขพื้นฐาน
เมธอดต่อไปนี้ใช้สำหรับการดำเนินการแก้ไขพื้นฐาน
Add a line to the end of a path:
line_to(point)
line_to(x, y)
Add a line at a specified position in a path:
line_to(point, index)
line_to(x, y, index)
Add a cubic Bezier curve to the end of a path:
cubic_bezier_to(point1, point2, point3)
cubic_bezier_to(x1, y1, x2, y2, x3, y3)
Add a cubic Bezier curve at a specified position in a path:
cubic_bezier_to(point1, point2, point3, index)
cubic_bezier_to(x1, y1, x2, y2, x3, y3, index)
Add a quadratic Bezier curve to the end of a path:
quadratic_bezier_to(point1, point2)
quadratic_bezier_to(x1, y1, x2, y2)
Add a quadratic Bezier curve at a specified position in a path:
quadratic_bezier_to(point1, point2, index)
quadratic_bezier_to(x1, y1, x2, y2, index)
Append an arc to a path:
arc_to(width, heigth, startAngle, sweepAngle)
Close the current figure in a path:
close_figure()
Set the position for the next point:
move_to(point)
move_to(x, y)
Remove the path segment at a given index:
remove_at(index)
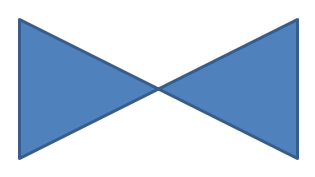
เพิ่มจุดกำหนดเองให้กับรูปทรง
ในส่วนนี้คุณจะได้เรียนรู้วิธีกำหนดรูปทรงอิสระโดยการเพิ่มลำดับจุดของคุณเอง โดยการระบุจุดที่เรียงลำดับและประเภทของเส้นส่วน (เส้นตรงหรือเส้นโค้ง) และโดยอาจปิดเส้นทางได้ คุณสามารถวาดกราฟิกกำหนดเองที่แม่นยำ—เช่น รูปหลายเหลี่ยม, ไอคอน, คำอธิบาย, หรือโลโก้—โดยตรงบนสไลด์ของคุณ
- สร้างอินสแตนซ์ของคลาส GeometryShape และตั้งค่าเป็น ShapeType.RECTANGLE
- ดึงอินสแตนซ์ของ GeometryPath จากรูปทรง
- ใส่จุดใหม่ระหว่างสองจุดบนสุดของเส้นทาง
- ใส่จุดใหม่ระหว่างสองจุดล่างสุดของเส้นทาง
- นำเส้นทางที่อัปเดตไปใช้กับรูปทรง
โค้ด Python ต่อไปนี้แสดงวิธีเพิ่มจุดกำหนดเองให้กับรูปทรง:
import aspose.slides as slides

with slides.Presentation() as presentation:
    slide = presentation.slides[0]

    shape = slide.shapes.add_auto_shape(slides.ShapeType.RECTANGLE, 100, 100, 200, 100)

    geometry_path = shape.get_geometry_paths()[0]
    geometry_path.line_to(100, 50, 1)
    geometry_path.line_to(100, 50, 4)

    shape.set_geometry_path(geometry_path)

    presentation.save("custom_points.pptx", slides.export.SaveFormat.PPTX)
ลบจุดออกจากรูปทรง
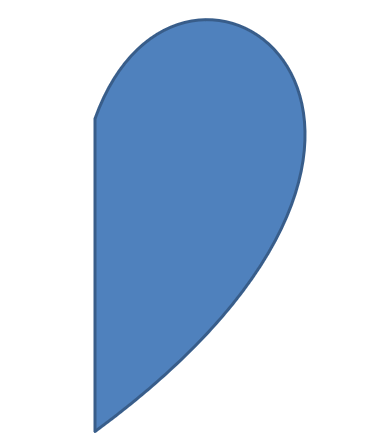
บางครั้งรูปทรงกำหนดเองอาจมีจุดที่ไม่จำเป็นทำให้เรขาคณิตซับซ้อนหรือมีผลต่อการเรนเดอร์ ส่วนนี้จะแสดงวิธีลบจุดเฉพาะออกจากเส้นทางของรูปทรง เพื่อให้คุณสามารถทำให้อะแดรสเส้นรอบรูปเรียบง่ายและแม่นยำยิ่งขึ้น
- สร้างอินสแตนซ์ของคลาส GeometryShape และตั้งค่าเป็นประเภท ShapeType.HEART
- ดึงอินสแตนซ์ของ GeometryPath จากรูปทรง
- ลบเส้นส่วนออกจากเส้นทาง
- นำเส้นทางที่อัปเดตไปใช้กับรูปทรง
โค้ด Python ต่อไปนี้แสดงวิธีลบจุดออกจากรูปทรง:
import aspose.slides as slides

with slides.Presentation() as presentation:
    slide = presentation.slides[0]

    shape = slide.shapes.add_auto_shape(slides.ShapeType.HEART, 100, 100, 300, 300)

    path = shape.get_geometry_paths()[0]
    path.remove_at(2)

    shape.set_geometry_path(path)

    presentation.save("removed_points.pptx", slides.export.SaveFormat.PPTX)
สร้างรูปทรงกำหนดเอง
สร้างรูปเวกเตอร์ที่ออกแบบเฉพาะโดยกำหนด GeometryPath และประกอบจากเส้นตรง, วงโค้ง, และเส้นโค้ง Bézier ส่วนนี้แสดงวิธีสร้างเรขาคณิตกำหนดเองจากศูนย์และเพิ่มรูปที่ได้ลงบนสไลด์ของคุณ
- คำนวณจุดสำหรับรูปทรง
- สร้างอินสแตนซ์ของคลาส GeometryPath
- เติมข้อมูลจุดลงในเส้นทาง
- สร้างอินสแตนซ์ของคลาส GeometryShape
- นำเส้นทางไปใช้กับรูปทรง
โค้ด Python ต่อไปนี้แสดงวิธีสร้างรูปทรงกำหนดเอง:
import aspose.slides as slides
import aspose.pydrawing as draw
import math

points = []

R = 100
r = 50
step = 72

for angle in range(-90, 270, step):
    radians = angle * (math.pi / 180)
    x = R * math.cos(radians)
    y = R * math.sin(radians)
    points.append(draw.PointF(x + R, y + R))

    radians = math.pi * (angle + step / 2) / 180.0
    x = r * math.cos(radians)
    y = r * math.sin(radians)
    points.append(draw.PointF(x + R, y + R))

star_path = slides.GeometryPath()
star_path.move_to(points[0])

for i in range(len(points)):
    star_path.line_to(points[i])

star_path.close_figure()

with slides.Presentation() as presentation:
    slide = presentation.slides[0]

    shape = slide.shapes.add_auto_shape(slides.ShapeType.RECTANGLE, 100, 100, R * 2, R * 2)
    shape.set_geometry_path(star_path)

    presentation.save("custom_shape.pptx", slides.export.SaveFormat.PPTX)

สร้างรูปทรงกำหนดเองแบบคอมโพสิต
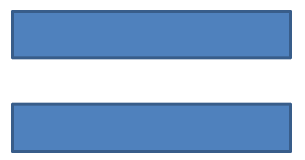
การสร้างรูปทรงกำหนดเองแบบคอมโพสิตช่วยให้คุณรวมหลายเส้นทางเรขาคณิตเข้าด้วยกันเป็นรูปเดียวที่สามารถนำกลับมาใช้ซ้ำได้บนสไลด์ กำหนดและผสานเส้นทางเหล่านี้เพื่อสร้างภาพที่ซับซ้อนเกินกว่าชุดรูปมาตรฐาน
- สร้างอินสแตนซ์ของคลาส GeometryShape
- สร้างอินสแตนซ์แรกของคลาส GeometryPath
- สร้างอินสแตนซ์ที่สองของคลาส GeometryPath
- นำทั้งสองเส้นทางไปใช้กับรูปทรง
โค้ด Python ต่อไปนี้แสดงวิธีสร้างรูปทรงกำหนดเองแบบคอมโพสิต:
import aspose.slides as slides

with slides.Presentation() as presentation:
    slide = presentation.slides[0]

    shape = slide.shapes.add_auto_shape(slides.ShapeType.RECTANGLE, 100, 100, 200, 100)

    geometry_path_0 = slides.GeometryPath()
    geometry_path_0.move_to(0, 0)
    geometry_path_0.line_to(shape.width, 0)
    geometry_path_0.line_to(shape.width, shape.height/3)
    geometry_path_0.line_to(0, shape.height / 3)
    geometry_path_0.close_figure()

    geometry_path_1 = slides.GeometryPath()
    geometry_path_1.move_to(0, shape.height/3 * 2)
    geometry_path_1.line_to(shape.width, shape.height / 3 * 2)
    geometry_path_1.line_to(shape.width, shape.height)
    geometry_path_1.line_to(0, shape.height)
    geometry_path_1.close_figure()

    shape.set_geometry_paths([ geometry_path_0, geometry_path_1])

    presentation.save("composite_shape.pptx", slides.export.SaveFormat.PPTX)
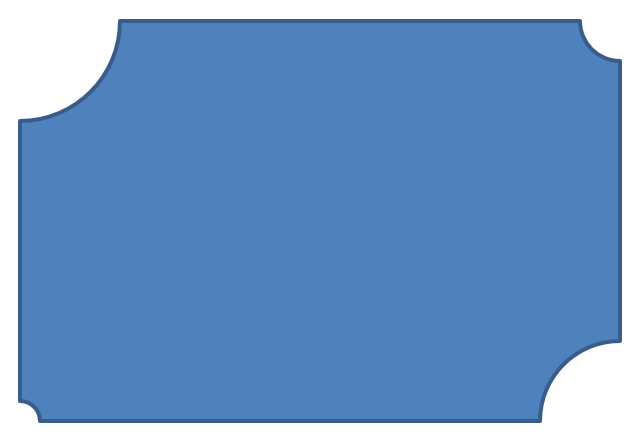
สร้างรูปทรงกำหนดเองที่มุมโค้งมน
ส่วนนี้จะแสดงวิธีวาดรูปทรงกำหนดเองที่มุมโค้งมนอย่างนุ่มนวลโดยใช้เส้นทางเรขาคณิต คุณจะผสานเส้นตรงและวงโค้งส่วนวงกลมเพื่อสร้างโครงร่างและเพิ่มรูปที่เสร็จแล้วลงบนสไลด์ของคุณ
โค้ด Python ต่อไปนี้แสดงวิธีสร้างรูปทรงกำหนดเองที่มุมโค้งมน:
import aspose.slides as slides
import aspose.pydrawing as draw

shape_x = 20
shape_y = 20
shape_width = 300
shape_height = 200

left_top_size = 50
right_top_size = 20
right_bottom_size = 40
left_bottom_size = 10

with slides.Presentation() as presentation:
    slide = presentation.slides[0]

    shape = slide.shapes.add_auto_shape(
        slides.ShapeType.CUSTOM, shape_x, shape_y, shape_width, shape_height)

    point1 = draw.PointF(left_top_size, 0)
    point2 = draw.PointF(shape_width - right_top_size, 0)
    point3 = draw.PointF(shape_width, shape_height - right_bottom_size)
    point4 = draw.PointF(left_bottom_size, shape_height)
    point5 = draw.PointF(0, left_top_size)

    geometry_path = slides.GeometryPath()
    geometry_path.move_to(point1)
    geometry_path.line_to(point2)
    geometry_path.arc_to(right_top_size, right_top_size, 180, -90)
    geometry_path.line_to(point3)
    geometry_path.arc_to(right_bottom_size, right_bottom_size, -90, -90)
    geometry_path.line_to(point4)
    geometry_path.arc_to(left_bottom_size, left_bottom_size, 0, -90)
    geometry_path.line_to(point5)
    geometry_path.arc_to(left_top_size, left_top_size, 90, -90)
    geometry_path.close_figure()

    shape.set_geometry_path(geometry_path)

    presentation.save("curved_corners.pptx", slides.export.SaveFormat.PPTX)
ตรวจสอบว่ารูปทรงของเรขาคณิตเป็น Closed หรือไม่
รูปทรงที่ปิด (closed) หมายถึงรูปที่ทุกด้านเชื่อมต่อกันครบถ้วนโดยไม่มีช่องว่าง รูปแบบนี้อาจเป็นรูปเรขาคณิตง่ายหรือโครงร่างกำหนดเองที่ซับซ้อน ตัวอย่างโค้ดต่อไปนี้แสดงวิธีตรวจสอบว่ารูปทรงของเรขาคณิตเป็น closed หรือไม่:
def is_geometry_closed(geometry_shape):
    is_closed = None

    for geometry_path in geometry_shape.get_geometry_paths():
        data_length = len(geometry_path.path_data)
        if data_length == 0:
            continue

        last_segment = geometry_path.path_data[data_length - 1]
        is_closed = last_segment.path_command == PathCommandType.CLOSE

        if not is_closed:
            return False

    return is_closed
FAQ
จะเกิดอะไรขึ้นกับการเติมสีและแนวขอบหลังจากเปลี่ยนเรขาคณิต?
สไตล์จะยังคงอยู่กับรูปทรง; มีเพียงคอนทัวร์ที่เปลี่ยน การเติมสีและแนวขอบจะถูกนำมาใช้โดยอัตโนมัติกับเรขาคณิตใหม่
ฉันจะหมุนรูปทรงกำหนดเองพร้อมกับเรขาคณิตอย่างถูกต้องได้อย่างไร?
ใช้คุณสมบัติ rotation ของรูปทรง; เรขาคณิตจะหมุนพร้อมกับรูปทรงเนื่องจากถูกผูกกับระบบพิกัดของรูปทรงนั้นเอง
ฉันสามารถแปลงรูปทรงกำหนดเองเป็นภาพเพื่อ “ล็อกผลลัพธ์” ได้หรือไม่?
ได้. ส่งออกส่วน slide ที่ต้องการหรือ shape เองเป็นรูปแบบแรสเตอร์; วิธีนี้จะทำให้การทำงานต่อกับเรขาคณิตที่ซับซ้อนง่ายขึ้น